Development of High Efficiency SHJ/Poly-Si Passivating
|
|
|
- Susan Bryan
- 6 years ago
- Views:
Transcription

1 Master of Science Thesis Development of High Efficiency SHJ/Poly-Si Passivating Contact Hybrid Solar Cells Hao Ge
2
3 Development of High Efficiency SHJ/Poly-Si Passivating Contact Hybrid Solar Cells A thesis submitted for the degree of Master of Science in Sustainable Energy Technology at Delft University of Technology Hao Ge July 2017 PVMD group, Sustainable Energy Technology, EEMCS faculty, Delft University of Technology


4 Graduate Hao Ge MSc Sustainable Energy Technology Faculty of Electrical Engineering, Mathematics and Computer Science (EEMCS) Supervisors Dr. Olindo Isabella Ir. Gianluca Limodio Dr. Guangtao Yang MSc Thesis Committee Prof. dr. Miro Zeman, PVMD / ESE Prof. dr. Arthur Weeber, PVMD / ESE Dr. Sten Vollebregt, ECTM Dr. Olindo Isabella, PVMD / ESE Ir. Gianluca Limodio, PVMD / ESE Delft University of Technology Department of Electrical Sustainable Energy Photovoltaic Materials and Devices
5 Abstract To improve the conversion efficiency of c-si solar cells, it is crucial to quench the recombination losses at c-si/metal interface. Such recombination losses are able to be reduced by using carrier-selective passivating contacts by means of hydrogenated amorphous silicon (a-si:h) and poly-crystalline silicon (poly-si)/tunneling silicon oxide (SiO x). In this thesis, a novel hybrid solar cell concept is presented. The novel structure combines the advantages of silicon heterojunction (SHJ) as front surface field (FSF) and poly-si passivating contact as rear emitter. This project aims to improve the passivation quality of FSF composed of intrinsic & n-type (i/n) a-si:h stacks and evaluate transparent conductive oxide (TCO) layer. Considering FSF optimization, effective cleaning pre-treatment has been developed to provide ultra-clean surface and prevent cross-contamination. Lifetime measurements has shown that three cycles of NAOC improves effective lifetime significantly to 12.6 ms on symmetric structure. Plasma cleaning of chamber and plasma deposition on substrate holder decreases saturation current density (J 0) by 10.9 fa/cm 2. Comparing to post-deposition annealing in air, H 2 environment annealing shows more appealing passivation quality which improves effective lifetime to 4.7 ms and reduces J 0 to 28.7 fa/cm 2 on solar cell precursors. V OC demonstrates improvements for thicker i a-si:h films, but leading to more parasitic absorption losses. This effect results in a trade-off between V OC and J SC. Furthermore, thicker i a-si:h layer degrades the carrier transport by means of FF. In terms of TCO optimization, novel hydrogen-doped indium oxide (IO:H)/indium tin oxide (ITO) stacks is presented as an attractive alternative to replace conventional single ITO layer. Hall effect measurements have shown that post-annealing in vacuum is an effective method to decrease carrier density and increase mobility of IO:H/ITO stacks. Accordingly, the opto-electrical properties of IO:H/ITO stacks, single ITO layer and single IO:H layer are compared. 180 C annealed sample shows optimal performance with high mobility of 117 cm 2 /(V s) and low carrier density of cm -3. Either IO:H/ITO stacks or IO:H single layer shows nearly 4 times higher mobility and half carrier density compared to single ITO film after post-deposition annealing. Spectra measurements reveal that the parasitic absorption of IO:H/ITO stacks is lower than that of ITO film over the complete spectral range. Before post-deposition annealing, it was observed that TCO sputtering decreases passivation quality, but it is less pronounced for IO:H than ITO deposition. However, after post-deposition annealing, passivation degradation is able to be nearly fully recovered for both sputtering: IO:H and ITO.
6 Based on aforementioned optimization, the highest conversion efficiency of 20.5% was achieved (V OC = 704 mv, J SC = 39.5 ma/cm 2 and FF = 73.8%). Keywords: Amorphous silicon, passivating contact, transparent conductive oxide, high mobility, hydrogen-doped indium oxide, indium tin oxide ii
7 Contents Abstract... i 1 Introduction Photovoltaic technology: wafer-based crystalline silicon solar cells Recombination mechanisms and passivation Recombination mechanisms Indicators for recombination losses Surface passivation mechanisms Main passivating contacts Motivation for SHJ/poly-Si passivating contact hybrid solar cells Silicon heterojunction (SHJ) solar cells Poly-Si passivating contact solar cells Motivation for developing hybrid solar cells Limiting factors for high efficiency hybrid solar cells Passivation of p-type poly-si/sio x contact Wafer front surface texturing and wafer cleaning Trade-off between V OC and J SC in a-si:h layers Parasitic absorption and resistivity loss in TCO layer Front and rear metal contacts Scientific questions Thesis outline Techniques for Hybrid Solar Cells Fabrication and Characterization Fabrication of hybrid solar cells Carrier-selective passivating rear emitter Heterojunction front surface field Front transparent conductive oxide Front and rear metal contacts Opto-electrical properties of films and devices Quasi-Steady-State Photoconductance (QSSPC) measurement Hall effect measurement Four-point probe Illuminated J-V... 32
8 2.2.5 Reflectance, transmittance and absorbance External quantum efficiency Influence of Intrinsic/n-type a-si:h Layers on Hybrid Solar Cells Introduction Passivation of i/n a-si:h stacks and performance on solar cells Importance of cleaning procedures Effect of post-deposition annealing Thickness optimization of i/n a-si:h stacks Conclusion Influence of IO:H/ITO stacks on Hybrid Solar Cells Introduction Opto-electrical properties of IO:H/ITO stacks Effect of post-deposition annealing on IO:H/ITO samples Comparison between ITO layer and IO:H/ITO stacks Conclusion Conclusions and Outlook Conclusions Outlook Fill factor boost Current increase Passivation improvement Acknowledgements Bibliography Appendix iv
9 1 Introduction 1.1 Photovoltaic technology: wafer-based crystalline silicon solar cells With world population and energy demand increase, the traditional energy supplies from fossil fuels as coal, oil and natural gas cannot meet the growing demand alone [1] [3]. Besides, the incredible amount of fossil fuel consumption causes serious environmental issues, such as air pollution and CO 2 emission. Renewable energies provide more promising and environmentally-friendly alternatives. Among these renewable energies, solar energy becomes more and more appealing due to the infinite resource, convenient application, decentralized system and dramatically decreasing cost. In the last few years, the cumulative installation of PV modules grew up to 220 GW p. Moreover, the prominent boom mainly comes from the increase production of crystalline silicon (c-si) based modules, which consists of monocrystalline silicon (mono-si) and multicrystalline silicon (multi-si). Compared to thin film solar cells, the advantages of c-si cells include high efficiency, high stability, ease of fabrication and longevity.

10 (a) (b) Figure 1.1: (a) Global cumulative PV installation until 2015; (b) Annual PV production worldwide (in GWp) production numbers reported by different analysts vary from between 50 and 65 GWp [4]. 1.2 Recombination mechanisms and passivation Recombination mechanisms Recombination processes describe the annihilation of generated electrons and holes in the bulk region and surface (or interface), which prohibit the carrier transport and decrease the carrier lifetime, thus are detrimental for achieving high-efficiency solar cells with decreasing the V OC and FF of the devices. The recombination mechanisms consist of two main parts [5]: (i). Bulk recombination Radiative recombination Auger recombination Shockley-Read-Hall (SRH) recombination (ii). Surface recombination Radiative and Auger recombination occur in the defect-free semiconductors, while SRH recombination happens in the existence of the impurities or crystal defects in the semiconductors [6]. 2
11 Radiative recombination Radiative recombination is a direct recombination process of electrons at valence band with holes at conduction band, which releases the excess energy, corresponding to the bandgap, as photons. It is the e - E C h + E V Figure 1.2: Radiative recombination in bulk semiconductors. opposite direction of the radiative generation, the main generation process, which refers to the generation of electron-hole pairs due to the absorption of photons with sufficient energy to break the bonds. Radiative recombination mostly happens in the direct bandgap materials, so it is not the dominating recombination mechanism for indirect bandgap materials, such as crystalline silicon, as a phonon is required to conserve energy and momentum simultaneously [7]. Auger recombination Auger recombination describes electron-hole recombination process which transfers the energy and momentum to a third free charge carrier (hole or electron), as illustrated in Figure 1.3. The hole (electron), obtained the energy and momentum, becomes active and jumps to lower (higher) energy e - e - E C E V h + h + (a) (b) Figure 1.3 : Auger recombination in the bulk: (a) eeh interaction and (b) ehh interaction. 3
12 level in valence (conduction) band. Finally, the energy and momentum thermalize when the carrier returns back to the most stable state (valence band top for hole and conduction band bottom for electron). So it is a three-particle-involving process: electron-electron-hole (eeh) or electron-hole-hole (ehh) interaction. In indirect semiconductors, Auger recombination is the main recombination process. SRH recombination When there exist impurity atoms (such as iron/copper) or lattice defects in the semiconductors, these defects act as the recombination centers and induce electrons and holes to recombine. The excess energy is then dissipated in the form of heat. It is commonly known as Shockley-Read-Hall (SRH) recombination. These recombination centers introduce allowed energy level within the forbidden gap, named trap states. It is also the dominant recombination process in semiconductors as semiconductor devices for solar cell fabrication can hardly be totally pure without any defects. e - E C Trap state h + E V Figure 1.4: SRH recombination induced by trap state in the bulk. Surface recombination In the research aim, the high-quality float-zone (FZ) wafers are commonly used, therefore the bulk recombination is negligible in most cases. Only the recombination induced by imperfect surface state is of great importance due to dangling bonds (DB) present on the surface. Crystalline silicon has a diamond cubic crystal structure in which the silicon atom repeats itself in long range order. In the bulk region normally the Si atom is bonded with four neighboring atoms, while in the surface, the termination of the crystal lattice, four valence electrons in Si atom do not fully form bonds. Figure 1.5 shows two common planes in c-si structure, (100) surface and (111) surface respectively. The three integers in (100) and (111) are so-called Miller indices [8]. As shown in Figure 1.5 (a), the Si atom in (100) plane surface has two dangling bonds while in Figure 1.5 (b), only one unbonded valence electron or dangling bond is presented in (111) plane. 4
![(a) (b) Figure 1.5: Lattice planes of (a) (100) surface, and (b) (111) surface in crystalline silicon [5].](/docs-images/80/81166148/images/13-0.jpg "The yellow planes are (100) and (111) surfaces respectively and the red lines stand for dangling bonds in the surface.")
13 (a) (b) Figure 1.5: Lattice planes of (a) (100) surface, and (b) (111) surface in crystalline silicon [5]. The yellow planes are (100) and (111) surfaces respectively and the red lines stand for dangling bonds in the surface. The surface recombination rate U s, via a single-level surface state E t within the forbidden gap, is then defined by [9], [10] U s = n sp s n i 2 ns+n1 Sp0 + p s+p1 Sn0 (1.1) where n s (p s) is the electrons (holes) concentration at the surface; n i is the intrinsic carrier concentration; n 1 (p 1) is the electrons (holes) density when the Fermi level coincides with the trap state E t; S n0 (S p0) is the surface recombination velocity of electrons (holes). Besides the effective surface recombination velocity (SRV) S eff at the edge of surface space charge region (in x = d) can be determined by S eff = U s n(x=d) (1.2) where Δn is the excess minority carrier density. The surface recombination velocity gives some indication of the surface characteristics. If there is no recombination happened in surface, the movement of carriers towards to the surface is zero, thus the surface recombination velocity is zero as well. To conclude, since high-quality FZ wafers are used for research in the lab, the bulk region has a 5
14 very low defect density therefore three types of bulk recombination are negligible. On the other hand, the existence of the dangling bonds in the surface makes the surface recombination an importance issue for further improvement of V OC and FF of c-si solar cells Indicators for recombination losses To evaluate the recombination losses there are two indicators: effective minority carrier lifetime τ eff and saturation current density J 0, which can be measured from WCT-120 Sinton Lifetime Tester. Effective minority carrier lifetime The average time which the excess minority carriers survive before recombination, described as effective minority carrier lifetime τ eff, is given by 1 = = (1.3) τ eff τ bulk τ s τ rad τ Aug τ SRH τ s where τ bulk, τ rad, τ Aug, τ SRH and τ s are minority carrier lifetime due to bulk, radiative, Auger, SRH and surface recombination respectively. If the front and rear surface are assumed equal and the photogenerated carriers are uniform, the minority carrier lifetime from surface recombination can be simplified to 1 = 2S eff τ s d (1.4) where S eff refers to the effective surface recombination velocity and d is the thickness of substrate. The effective surface recombination velocity is an important indicator for recombination loss as well. High lifetime (normally several milliseconds) is essential for fabricating high-efficiency c-si solar cell. Typically, τ eff is in the range of hundred microseconds to several milliseconds for c-si solar cells. Saturation current density Saturation current density, J 0, also known as dark current density, is a part of the reverse current in a pn jucntion caused by minority carriers diffusion from the neutral regions to the depletion region [8], which is given by 6
15 J 0 = qn i 2 ( D n + D p ) (1.5) L n N a L p N d where q and n i are the elementary charge and intrinsic carrier concentration; D n (D p) is diffusion coefficient of minority carrier electrons (holes); L n (L p) is the diffusion length of electrons (holes); N a and N d are minority carrier electrons concentration in p-type semiconductor and hole concentration in n-type semiconductor respectively. Saturation current density should be as low as possible to improve the effective passivation quality. The typical unit is [fa/cm 2 ] and normally it ranges from 1 fa/cm 2 to several hundred fa/cm 2 for c-si solar cells Surface passivation mechanisms To suppress the surface recombination, two fundamental methods are applied: (i). the reduction of surface defect density D it (known as chemical passivation); (ii). the reduction of electrons or holes concentration at the surface (defined as field-effect passivation). which are so-called surface passivation techniques. Chemical passivation Using other atoms to passivate the dangling bonds of the Si surface, which eliminates (or partially) the surface defect density, is called chemical passivation. Common techniques are forming Si-H bonds or Si-O bonds to saturate the dangling bonds by growing ultra-thin layers, such as hydrogenated amorphous silicon (a-si:h) or silicon dioxide (SiO 2) layers. Chemical vapour deposition (CVD) is one of the methods to produce high-quality thin layers. Precursor gasses are brought into the reaction chamber, and then react with the substrate, finally a solid phase material is formed and passivates the dangling bonds. Besides, acid cleaning such as nitric acid (HNO 3) or hydrofluoric acid (HF) also can form Si-O bonds or Si-H bonds to terminate the dangling bonds. Field-effect passivation According to the equation 1.1, the highest surface recombination rate happens at the point where the electrons and holes concentration are approximately equal at the surface. Therefore, decreasing one of the two carriers concentration at the surface can effectively limit recombination rate and provides good passivation effect. To separate the electrons and holes, the internal electric field across the surface, known as field-effect passivation, can be achieved by (i) introducing a doping profile within the semiconductor, such as p + /n + -doped region 7
16 (known as surface field), or (ii) applying highly charged dielectric which has high density charges itself, such as positively-charged SiO 2 and negatively-charged Al 2O 3. The introduction of a doping profile can be achieved by adding dopant atoms into a narrow surface region or depositing other layers by means of thermal diffusion, ion implantation or chemical vapour deposition methods. Regarding heavily doped region, the high-low junction with the same doping type (p + -p or n + -n junction) or p-n junction with the opposite doping can be formed. The field-effect passivation also can be introduced by depositing or growing a thin insulator in order to form a carrier-selective layer. Thus charges storing in the dielectric films induce an internal electric field which hinders the accumulation of one specific carrier at the interface Main passivating contacts The main passivation materials include thermal silicon dioxide (SiO 2) with relatively low positive charges, hydrogenated amorphous silicon nitride (a-sin x:h) with high positive charge density, aluminum oxide (Al 2O 3) with negative fixed charges and hydrogenated amorphous silicon (a-si:h). Besides, the incorporation of different stacks enhance passivation effect further, including SiN x/sio 2 [11], [12], SiN x/al 2O 3 [13], SiN x/a-si:h stacks [10]. Silicon dioxide provides good passivation quality mainly due to the chemical passivation by decreasing the defect density at the interface [10]. Although there are positive fixed charges within the SiO 2 dielectric in the range of several cm -2 [15], [16], it is not enough to trigger the effective field-effect passivation. Therefore, chemical passivation plays a primary role on the c-si/sio 2 interface. Furthermore, SiO 2 can provide an excellent antireflection effect thanks to suitable refractive index of around 1.5. Thermal oxidation is a common technique to form high quality and dense SiO 2, which can be achieved by exposing the Si wafer to an oxidizing environment at high temperature. Dry thermal or wet thermal approaches then can be divided according to O 2 or H 2O-vapor environment in thermal annealing furnaces. The record high lifetimes of 29 ms and 32 ms were measured for n-type (resistivity 90 Ω cm) and p-type (150 Ω cm) float zone wafers passivated by alnealed (evaporate Al onto the oxide, then anneal at 400 C in forming gas environment) silicon oxide, with extremely low S eff less than 1 cm s -1 [17]. Silicon nitride is a widely used material in industry which also has excellent surface passivation and antireflection effect. Good chemical passivation can be achieved since a large amount of hydrogen is generated during the formation of SiN x film. Hydrogenation process can terminate dangling bonds at the interface. Besides, SiN x can induce effective field-effect passivation in N-rich structure on account of high positive fixed charge density of the order of cm -2 [18]. Antireflection properties of SiN x layer can reduce light reflection significantly due to the optimal value of refractive index around 2.0. Silicon nitride can be produced by direct or remote PECVD with the precursor gasses of SiH 4 and NH 3 [19], [20], which can control the goal 8
17 thickness precisely. The structure of a-sin x:h consists of two main types: Si-rich film, which exhibits similar amorphous-silicon properties; N-rich film with high positive fixed charge density [21]. The record low S eff of 4 and 20 cm/s on 1.5 and 0.7 Ω cm low-resistivity polished p-type FZ wafers has been achieved by remote PECVD silicon nitride [19]. Compared with aforementioned positive charge films, aluminum oxide has been proven to be an effective passivation contact with negative fixed charge in the range of cm -2 [22], [23], which is quite high to provide excellent field-effect passivation on c-si wafers. Best passivation quality of Al 2O 3 layer can be mainly obtained by thermal or plasma-assisted atomic layer deposition (ALD) with a limiting growth rate of 2 nm/min [22]. Surface recombination velocity (SRV) can be less than 10 cm/s on low-resistivity n- and p-type FZ wafers passivated by high-rate spatial ALD Al 2O 3 film [22]. Another emerging outstanding passivation material is hydrogenated amorphous silicon, which provides excellent chemical passivation by intrinsic layer and field-effect passivation by doped films. Phosphine (PH 3) or diborane (B 2H 6), as doping precursor gasses, can be added to form n-type or p-type a-si:h layers combined with gas silane (SiH 4), sometimes hydrogen (H 2) as well. PECVD is a typical deposition technique to form homogeneous and high-quality a-si:h films. Good result was obtained on n-type FZ <100> wafer covered by 50 nm-thick rf PECVD intrinsic a-si:h layers on both sides [24]. The lifetime is as high as 10.3 ms after prolonged annealing (for 100 h) at 200 C in N 2 ambient with outstanding SRV of 1.32 cm/s assuming infinite bulk c-si lifetime [24]. Since passivating contacts are of significantly importance of achieving high-efficiency solar cells, in this thesis, two outstanding structures containing SiO x and a-si:h contacts are integrated to provide excellent passivation for back emitter and front surface field. 1.3 Motivation for SHJ/poly-Si passivating contact hybrid solar cells Silicon heterojunction (SHJ) solar cells Silicon heterojunction solar cells (SHJ) have attracted much attention in research since Sanyo first fabricated HIT (Heterojunction with Intrinsic Thin layer) solar cell with conversion efficiency of 20.0% on 1 cm 2 CZ n-type c-si wafer in 1994 [25]. It proved that this sandwiched-device, c-si wafer between the front and rear doped a-si:h layers, can be a promising structure with inserting intrinsic a-si:h as passivation layers. Later on, many research groups and institutions devoted to pushing the record higher by improving surface passivation with more effective cleaning process and low-damage plasma process [26], decreasing parasitic absorption in a-si:h and TCO layers [27], [28], and lowering the resistivity of TCO layer and electrode materials [29], [30]. The state-of-the-art research record on standard 9
![HIT solar cells was 24.7% on n-type CZ wafer of 98 μm thickness and 101.8 cm 2 practical size, achieved by Panasonic Corporation in 2013 [31].](/docs-images/80/81166148/images/18-0.jpg "To reduce optical loss from front grid electrode further, interdigitated back contact (HIT-IBC) structure hit the record of 25.6% with extremely high J SC of 41.")
![8 ma/cm 2 in 2014 [32], and even over 26% in 2017 by Kaneka corporation [33]. The detailed parameters are shown in Table 1.](/docs-images/80/81166148/images/18-1.jpg "1. Table 1.1: Records of high-efficiency HIT solar cells [27], [31] HIT solar cell HIT-IBC solar cell Area (cm 2 ) 101.8 143.7 Thickness (μm) 98 150 V OC (mv) 750 740 J SC (ma/cm 2 ) 39.5 41.")
18 HIT solar cells was 24.7% on n-type CZ wafer of 98 μm thickness and cm 2 practical size, achieved by Panasonic Corporation in 2013 [31]. To reduce optical loss from front grid electrode further, interdigitated back contact (HIT-IBC) structure hit the record of 25.6% with extremely high J SC of 41.8 ma/cm 2 in 2014 [32], and even over 26% in 2017 by Kaneka corporation [33]. The detailed parameters are shown in Table 1.1. Table 1.1: Records of high-efficiency HIT solar cells [27], [31] HIT solar cell HIT-IBC solar cell Area (cm 2 ) Thickness (μm) V OC (mv) J SC (ma/cm 2 ) FF (%) η (%) Year Figure 1.6: A schematic sturcture of n-type SHJ solar cell. As illustrated in Figure 1.6, normally n-type c-si wafers are used as the substrates. As-cut wafer is first textured in aqueous alkaline solution and wet-chemically cleaned afterwards combining 10
19 with HF dip to remove the local oxide at the wafer surface. A few-nanometer intrinsic a-si:h layer is then deposited at the front surface with subsequent p-type a-si layer to form the front emitter by PECVD method. Regarding BSF on the rear side, symmetric structure is fabricated by depositing intrinsic and n-type a-si films. In this sandwiched-structure, the intrinsic a-si:h layers provide an excellent chemical passivation of c-si surface, which can boost the V OC up to 700 mv compared to the structure without intrinsic layers [25]. The doped a-si:h layers can induce field-effect passivation to repel the minority carrier from accumulating around the surface, which can lower the carrier recombination possibility further. Since the lateral conductivity of the doped layers are rather poor, TCO layers are sputtered at both sides to help the lateral transport of carriers to external electrodes [21]. Besides, front TCO acts as antireflective coating to reduce the front reflectance loss. Back TCO behaves as an effective back reflector to ensure that most not absorbed light (in the NIR region) is reflected into the absorber again. Indium tin oxide (ITO) is a commonly used TCO material. The cell is finalized by simple screen printing technology of grid electrodes at both sides. Highly conductive silver paste was printed and sintered under the temperature of 200 C. Figure 1.7: Schematic band diagram of SHJ solar cell [34]. The carrier transport mechanism in n-type SHJ solar cell can be explained with the help of band diagram in Figure 1.7. Since c-si has an indirect bandgap of 1.12 ev and a-si:h has a direct bandgap of around 1.7 ev, which can be fine-tuned by hydrogen contents, a heterojunction can be formed when they connect. Band offsets of ΔE C and ΔE V are introduced in the conduction band and valence band respectively, which are independent of c-si substrate and a-si film 11
20 doping, with the values of approximately 0.15 ev and 0.45 ev [34], [35]. At the front junction (p-type emitter), holes transport to the interface between p-type a-si and c-si substrate, and could be trapped due to the valence band offset ΔE V. However, with the aid of tunneling and hopping, holes can overcome the energy barrier and transport to the p-type a-si:h layer and finally be collected at the front electrodes. While for electrons, they are rejected and can hardly pass through the interface because of the large energy barrier induced by p-type a-si layer. This effect is also called field-effect passivation. The same mechanism happens for electrons in n-type rear emitter. Only electrons can pass through the rear junction and be collected at rear metal. The advantages of SHJ solar cells can be attributed to four parts: (1) high efficiency over 24% owing to the extremely high V OC exceeding 740 mv after few nanometers intrinsic amorphous silicon layers passivation; (2) excellent temperature coefficient ensures more power output at higher temperature compared to traditional solar cells; (3) simple and low-temperature process cut the production cost further; (4) symmetric structure is less stressed that can pursue thinner wafer thickness, and can be fabricated as bifacial module Poly-Si passivating contact solar cells Another effective carrier-selective passivating contacts structure consists of an ultra-thin silicon oxide layer and a heavily-doped silicon layer having a phase of polycrystalline, amorphous or mixture. The pioneer structure of semi-insulating polycrystalline silicon (SIPOS) developed in 1985 boosts the open circuit voltage up to 720 mv [36]. Afterwards Fraunhofer ISE achieved 19.4% conversion efficiency based on the application of front/rear poly-si/sio x passivating contacts on p-type FZ wafers, which improves the V OC values exceeding 700 mv [37]. The highest conversion efficiency was 25.1% achieved by implementing a tunnel oxide combined with doped silicon film approach [38], called TOPCon (Tunneling Oxide Passivating Contacts), also developed by Fraunhofer ISE, which proves this structure very promising. Two main poly-si/sio x passivating contacts solar cell structures are shown and compared as followed in Figure 1.8 (a) and (b) respectively. They both include the stack of ultra-thin tunneling oxide layers and doped silicon layers in the form of polycrystalline [37], [39] or mixture of polycrystalline and amorphous [38] by CVD techniques. Wet-chemical cleaning, thermal oxidation and UV/O 3 methods are effective techniques to form an ultra-thin oxide layer around nm. Doped amorphous silicon layer can be formed by either depositing intrinsic amorphous silicon layer first by LPCVD combined with ex-situ doping process of ion implantation then or direct in-situ doped amorphous silicon layer by PECVD. Afterwards, a high-temperature annealing is carried out to transform the amorphous silicon to crystalline structure and activate and drive in the dopants to form effective energy barriers for certain carrier at the interface. The biggest difference of structure between top/rear contacted solar cell 12

 (b) Figure 1.8: Schematic sketches of (a) top/rear poly-si/siox contacts solar cell; (b) TOPCon solar cell. Table 1.")
21 and TOPCon solar cell lies in that symmetric layers of poly-si/sio x are applied to top structure of the first solar cell to provide excellent passivation quality, while the latter employs the Al 2O 3-passivated boron-diffused p-type emitter to decrease the parasitic absorption of front layers happened to the former, which benefits the J SC dramatically. The respective electrical parameters are shown in Table 1.2. (a) (b) Figure 1.8: Schematic sketches of (a) top/rear poly-si/siox contacts solar cell; (b) TOPCon solar cell. Table 1.2: Electrical parameters of poly-si passivating contacts solar cells [37], [38] Top/rear contacted solar cell TOPCon solar cell Area (cm 2 ) 4 4 V OC (mv) J SC (ma/cm 2 ) FF (%) η (%) An ultra-thin oxide layer plays an important role in surface passivation. It provides outstanding chemical passivation by saturating the dangling bonds in the c-si surface. Besides, it performs good carrier selectivity with 4.5 ev energy barrier for holes and 3.1 ev for electrons to tunnel [40]. The tunneling is considered as the main working principle for electrons/holes passing through the thin oxide layer, especially when the thickness is less than 2 nm [36], [41]. Recent studies introduced also pinhole-based mechanism for carrier transport when SiO 2 thickness is greater than 2 nm and oxide temperature formation is higher than 1000 C [41]. Furthermore, heavily-doped poly-si layer induces an accumulation layer at the interface due to the different 13

22 quasi-fermi level between c-si absorber and doped poly-si layer itself, which creates band bending to prevent certain kind of carriers from passing through. As illustrated in Figure 1.9, a phosphorus-doped poly-si layer forms electron selective barrier and only allows the electrons to pass through tunnel oxide and itself while the holes are rejected. This is also called field-effect passivation. Figure 1.9: Schematic band diagram of n + poly-si/siox passivating contact Motivation for developing hybrid solar cells To achieve high-efficiency silicon heterojunction solar cells, passivation quality of intrinsic/p-type a-si:h layer stacks are of great importance as n-type counterparts. Nevertheless, it is much more difficult to obtain excellent passivation quality of boron-doped a-si:h/c-si structure in the lab, even with an extra intrinsic a-si:h layer to form chemical passivation [42] [44]. In terms of intrinsic/phosphorus-doped a-si:h layer stacks, high minority carrier lifetime as 13.3 ms was reported on symmetric a-si:h (n + )/a-si:h (i)/c-si (n)/ a-si:h (i)/ a-si:h (n + ) planar sample with 20 nm and 5 nm n + /i a-si:h respectively after 255 C post-deposition annealing [43]. In our lab, excellent passivation quality was obtained on same symmetric structure with even thin a-si:h layer stacks of 4.5 nm i a-si:h and 6 nm n + layer on textured n-type FZ wafers. The minority carrier lifetime of 12.6 ms after 190 C post-deposition annealing and 4.8 ms as-deposited were measured at an injection level of cm -3. Regarding symmetric structure of i/p-type a-si:h stacks, passivation quality measured is not comparable and hard to control. Around 1 ms lifetime was reported in research groups after careful optimization [42], [43]. And in our lab, the average τ eff is around 600 μs with high J 0 of 54 fa/cm 2 for i/p + a-si:h stacks, which deteriorates the performance of silicon heterojunction 14
23 dramatically and leads to around 17% conversion efficiency. Several explanations may be attributed to this i/p layers degradation: boron contamination at the interface between the p and i layers induces serious carrier recombination [44]; H 2 effusion from thin intrinsic a-si:h film after depositing boron-doped a-si:h film. This phenomenon is even worse after post-deposition annealing [42], [43]; phosphorus contamination to i/p bilayers from depositing n-type film due to fabrication order. On the other hand, poly-si/sio x passivating contacts show promising potential in achieving high-efficiency solar cells. The phosphorus-doped n-type poly-si with tunneling oxide layers typically present a low recombination current of about 4-10 fa/cm 2, while as for boron-doped p-type poly-si/sio x passivating contacts, typically the values range from to 5-20 fa/cm 2 [38], [40], [45] [47]. In our lab, the n-type poly-si/sio x stacks achieved low J 0 value of 4.5 fa/cm 2 after a high temperature thermal annealing. And passivation quality of p-type poly-si is less excellent but still satisfactory with J 0 around 12 fa/cm 2. Passivation quality of symmetric samples on 1-5 Ω cm resistivity, 280 μm-thick n-type FZ c-si wafers were shown in Table 1.3. Symmetric samples were prepared by depositing passivating layers on both sides of c-si substrate, such as a-si:h (n + )/a-si:h (i)/c-si/a-si:h (i)/a-si:h (n + ) or poly-si (p + )/SiO x/c-si/sio x/poly-si (p + ). The tunnelling oxide was formed wet-chemically with the thickness around 1.5 nm. These passivation properties were measured after post-deposition annealing and saturation current density J 0 refers to the value of half symmetric structure. Table 1.3: Passivation properties of symmetric samples on n-type FZ c-si wafers Layer thickness Bulk Si (nm) τ eff iv OC J 0 (ms) (mv) (fa/cm 2 ) n + /i a-si:h Textured 6/ p + /i a-si:h Textured 5/ n + poly-si/sio x Planar p + poly-si/sio x Planar Since passivation of p-type/intrinsic a-si:h films is the limiting factor for achieving high-efficiency solar cells, p-type poly-si passivating contact behaves as a good candidate to provide excellent passivation quality with J 0 as low as 14.2 fa/cm 2. Based on these J 0 values, high V OC exceeding 700 mv can be expected. Besides, it is of great importance to provide insight into the carrier transport mechanism and fabrication process on high-efficiency c-si solar cells. To obtain better performance, monocrystalline FZ wafers are used. Compared to n-type wafers, p-type bulks suffer from light-induced degradation which forms boron-oxygen defects under the 15
![light exposure [5]. Besides, p-type substrates are more sensitive for impurities. Regarding these problems, n-type FZ wafers were chosen.](/docs-images/80/81166148/images/24-0.jpg "Two possible hybrid solar cell structures were proposed on n-type substrates based on the i/n + a-si:h stacks and SiO x/p + poly-si layers, as depicted in Figure 1.10.")
![Front emitter structure, shown in (a), may benefit the performance with better carrier transport under increased illumination at the emitter, thus higher fill factor [34].](/docs-images/80/81166148/images/24-1.jpg "However, the parasitic absorption loss of 250 nm-thick poly-si layer is more pronounced than approximately 10 nm-thick a-si:h layers, thus limiting the J SC inevitably for front emitter design [37].")
24 light exposure [5]. Besides, p-type substrates are more sensitive for impurities. Regarding these problems, n-type FZ wafers were chosen. Two possible hybrid solar cell structures were proposed on n-type substrates based on the i/n + a-si:h stacks and SiO x/p + poly-si layers, as depicted in Figure Front emitter structure, shown in (a), may benefit the performance with better carrier transport under increased illumination at the emitter, thus higher fill factor [34]. However, the parasitic absorption loss of 250 nm-thick poly-si layer is more pronounced than approximately 10 nm-thick a-si:h layers, thus limiting the J SC inevitably for front emitter design [37]. With keeping same level of V OC and FF, higher J SC can be obtained in the rear emitter sturcture. Moreover, the disadvantage of using p-type front poly-si passivating contact is that it affects holes collection due to current crowding at the front side which will limit the tunnelling mechanism. Therefore the priority is n-type wafer with rear emitter structure in this thesis. (a) (b) Figure 1.10: Possible structures of hybrid solar cells (not to scale): (a) n-type wafer with front emitter; (b) n-type wafer with rear emitter (priority in this thesis). Textured surface may be used to minimize external reflection and increase internal scattering for hybrid solar cells fabrication. 16
 c-si solar cells, three predominant parameters should basically meet requirements: J SC > 38 ma/cm 2, V")
25 Figure 1.11: Schematic band diagram of poly-si (p)/sio2/c-si (n)/a-si:h (i)/a-si:h (n + )/TCO structure of hybrid solar cells 1.4 Limiting factors for high efficiency hybrid solar cells To fabricate high efficiency (η>20%) c-si solar cells, three predominant parameters should basically meet requirements: J SC > 38 ma/cm 2, V OC > 700 mv and FF > 73%. The limiting factors primarily come from: (i) optical losses from surface reflection and parasitic absorption of non-absorber layers that limits the J SC, (iii) recombination losses caused by pronounced surface recombination which decreases the V OC and (iii) resistance losses due to barrier for carrier transport thus FF. These losses will be discussed in detail on different structure parts based on process flow Passivation of p-type poly-si/siox contact Since B-doped poly-si layer is placed at the rear side, the parasitic absorption at the long wavelength into this layer is merely pronounced compared to the front parasitic absorption of a-si:h and TCO layers. Thus, effective passivation quality is the primary task to be considered for rear emitter. Based on the research in our lab, two prerequisites include: (i) thermally-stable tunneling oxide which provides good chemical passivation to c-si surface and forms effective carrier selectivity; (ii) heavily B-doped poly-si which creates effective band bending at the poly-si/c-si interface and plays an important role in field-effect passivation. The quality of tunneling oxide is critical for passivation quality. If it is too thin, passivation quality deteriorates dramatically while too thicker oxide blocks the majority carriers tunnel through the oxide 17
26 interlayer. Normally the thickness keeps around 1.5 nm for effective tunnel mechanism. Besides it should resist to high-temperature annealing and keep stable rather than breaking up when the temperature is up to 1000 C [48]. The high passivation quality also strongly relies on the formation of heavily-doped poly-si film where the effective dopants should mostly be confined within poly-si layer and only a shallow portion diffuses into c-si bulk [37], [39]. The doping profile at the poly-si/c-si interface can be tuned by poly-si thickness, ion implantation dose, energy, thermal annealing temperature and time Wafer front surface texturing and wafer cleaning Random pyramidal texturing is typically employed in c-si wafers to minimize reflectance and increase the optical path length in the absorber layer, as so-called light in-coupling and light scattering respectively. Based on anisotropic etching, <100> oriented silicon surface is etched quickly than (111) surface. Therefore, the wafer with (100) planar surface is eventually converted into that of (111) textured surface covered with random upright pyramid in several microns. In our lab, TMAH (tetramethylammonium hydroxide, (CH 3) 4NOH) solution is used for etching solution with several ml ALKA-TEX. FREE solution to improve the texturing quality and extend bath lifetime. The size of random pyramids is of vital importance to surface reflection loss and passivation quality, which can be controlled by etching time and additive amount of ALKA-TEX. FREE solution. With smaller size pyramid texturing, higher J SC is obtained until to a certain level due to less reflection loss and enhanced light scattering within the absorber, while V OC also increases because less dangling bonds density on surface but is still not comparable to V OC on planar surface [49]. Typical wafer surface with upright random pyramids is shown in Figure Too short etching time causes surface not fully textured, while too long time leads to the large pyramid size up to 10 μm. Besides, more amount of ALKA-TEX. FREE additive accelerates the etching rate thus shorter etching time. For these reasons, optimal etching time is of great significance. Since during the texturing process, the wafers are contaminated by the etching solution and after texturing process the amorphous silicon layers will be deposited on textured silicon surface, which are very sensitive to possible contaminants. Therefore, the surface cleaning is an indispensable process to remove the organic, metallic residues and native oxide on the wafer surface. The effective cleaning may be applied for more than one cycle. The way to provide effective cleaning should be developed. 18

27 Figure 1.12: Wafer surface morphology after 30 min random pyramidal texturing in a solution of 5% TMAH and 5 ml ALKA-TEX. FREE. Taken in SEM Trade-off between VOC and JSC in a-si:h layers The variation of thickness on both intrinsic and n-type a-si:h layers has great impact on the performance of hybrid solar cells. Intrinsic and n-type a-si:h films provide outstanding passivation, however, as non-absorber layers on the front side, both absorb the incident light and generate parasitic absorption losses. Too thin intrinsic layer does not passivate the dangling bonds effectively, and too thin n-type film cannot form enough band bending at the interface to hinder the transport of minority carriers, which increase the recombination and degrade passivation quality dramatically thus lower V OC. While too thick a-si:h stacks increase parasitic absorption losses and lead to lower J SC due to the direct bandgap of around 1.7 ev and larger absorption coefficient in short wavelength region compared to c-si. It has been reported that the collection efficiency of carriers generated in doped a-si:h layer close to zero and only 30% absorbed light in intrinsic a-si:h layer contributes to J SC [50]. Moreover, thickness of i/n a-si:h stacks influence the carrier transport and resistivity loss as well, which leads to an optimal value of FF. Suitable post-deposition annealing improves passivation significantly partly because dissociative hydrogen has more chance to diffuse into the interface and passivates the left dangling bonds. While if the annealing temperature or time is too high or long, hydrogen effusion phenomenon happens which will deteriorate passivation quality. 19
28 1.4.4 Parasitic absorption and resistivity loss in TCO layer Since conductivity of doped amorphous silicon is rather poor, TCO layer is deposited on top. A good TCO layer should be conductive enough and concurrently transparent. High carrier concentration ( cm -3 ) and high mobility ( cm 2 /V s) are prerequisites for low resistivity of TCO layer, while low carrier concentration ( cm -3 ) is required to improve the transparency. Therefore, the plausible way is developing a TCO layer with high mobility (> 90 cm 2 /V s) but low carrier concentration (< cm -3 ). This can be achieved by changing TCO deposition parameters, post-deposition annealing optimization or developing advanced materials, such as IO:H (hydrogen-doped indium oxide). Moreover, the deposition of TCO will influence passivation quality for a-si:h stacks due to the damage of ion bombardment to a-si:h layers and possible hydrogen effusion from i a-si:h/c-si interface. Post-deposition annealing can partly heal or even fully recover passivation quality. Furthermore, work function of TCO affects the carrier transport from doped a-si:h layer to metal contact. If work function of TCO is much larger than that of n-type a-si:h, there will be a high energy barrier at the a-si:h (n)/tco interface which will hinder the transport of majority carrier electrons into front metal contacts. The suitable TCO work function should be in the range of 3.5 ev to 4.5 ev to achieve good ohmic contact according to modelling. Finally, as commonly used ARC (antireflective coating), the design of TCO layer should base on Rayleigh film principle and destructive interference to choose optimal refractive index and layer thickness Front and rear metal contacts The front metal pattern design is considerably complex due to the competition between unwelcomed metal shading and finger resistivity. In general, the metal contact area should be as small as possible through decreasing the width of finger to minimize metal shading and benefit J SC. However, to obtain a low resistivity finger design, the metal width and height should be as large as possible to increase the cross area. Moreover, the trade-off between J SC and FF also exist in finger spacing. With a closer finger spacing, it is desirable for a low emitter resistance due to better lateral transport, while it causes more shading and induces more recombination between TCO and metal interface, which are detrimental to J SC and V OC respectively. Therefore, the general design rules are proposed: (i) a high height-to-width aspect ratio with an optimal value of metal width; (ii) optimal finger spacing when the resistance losses equal to shading loss. As for rear metal contacts, since contact recombination between metal and p-type poly-si is quenched, full rear metal contact design is employed. In order to minimize the transmission through the back of the solar cell, silver (Ag) is used as a back reflector. 20
29 1.5 Scientific questions The aim of this project is to fabricate high efficiency (η>20%) silicon heterojunction/poly-si passivating contact hybrid solar cells by optimizing front surface field (FSF, consisting of i/n a-si:h films) and transparent conductive oxide (TCO) layer. The optimal thicknesses of intrinsic and n-type a-si:h layers should be investigated to minimize the parasitic absorption losses, while maintaining high passivation quality. A novel IO:H/ITO stacks, as an attractive alternative for conventional ITO single layer, should be developed and studied to ensure high transparency to minimize free carrier absorption (FCA) losses, but also high conductivity to guarantee high fill factor (FF). Considering two main experimental parts of FSF and TCO optimizations, following research questions are formulated: (i). Intrinsic and n-type a-si:h optimization How does the pre-deposition treatment influence passivation quality? What are the optimal post-adeposition nnealing conditions to improve passivation quality? Does H 2 flow annealing reduce the defect density further compared to conventional air annealing? How do the thicknesses of i/n a-si:h layers affect hybrid solar cells performance in terms of optical property, recombination and carrier transport? (ii). TCO optimization What is the optimal post-deposition annealing condition for IO:H/ITO stacks to quench free carrier absorption, and concurrently obtain high conductivity? What are the differences between IO:H/ITO stacks and ITO single layer in terms of opto-electrical properties and effect on passivation quality? How do IO:H/ITO stacks and ITO layer influence the hybrid solar cells performance? 21


30 Figure 1.13: 2D schematic structure of hybrid solar cells (not to scale). 1.6 Thesis outline This thesis consists of five chapters. Chapter 1 is the theoretical background of this project. Main recombination and passivation mechanisms behind solar cells are presented as well as relative indicators for recombination losses. Then the motivation and limiting factors for high efficiency SHJ/poly-Si passivating contact hybrid solar cells are illustrated followed by aim and outline of this thesis. Chapter 2 offers a detailed overview of the fabrication process of hybrid solar cells and opto-electrical properties characterization techniques of films and devices. In chapter 3, the importance of cleaning procedures are addressed first. Then post-deposition annealing conditions are investigated to improve surface passivation quality. The thicknesses of i/n a-si:h stacks are optimized to balance parasitic absorption loss and passivation quality gain. Chapter 4 presents a novel IO:H/ITO stacks design to improve J SC while keeping FF. Post-deposition annealing condition is evaluated first for IO:H/ITO stacks to achieve low carrier density and high mobility. Furthermore, the differences between IO:H/ITO stacks and ITO single layer are investigated to provide hints for different performances on hybrid solar cells. Finally, chapter 5 summarizes the findings from this project and presents outlook for further improvements on SHJ/poly-Si passivating contact hybrid solar cells. 22
31 2 Techniques for Hybrid Solar Cells Fabrication and Characterization 2.1 Fabrication of hybrid solar cells In this section, the fabrication steps of hybrid solar cells will be introduced. With the term of hybrid, it is intended as a solar cell that has a medium thermal budget, in the sense that high temperature approach of poly-si (T>900 C) and low temperature process of a-si:h (T<250 C) are combined. The carrier-selective passivating rear emitter consisting of ultra-thin tunneling oxide and heavily-doped p-type poly-si is formed first. After the front surface texturing, few-nanometer thick intrinsic and n-type a-si:h are deposited by PECVD as front surface field. Transparent conductive oxide is then sputtered on top of a-si:h layer to help lateral transport of electrons. Finally, front and rear metal contacts are formed by evaporation technique via lift-off method. In this work, high quality n-type FZ c-si wafers with <100> orientation, resistivity of 1 5 Ω cm and thickness of 280 μm were used as starting materials Carrier-selective passivating rear emitter Rear emitter consists of an ultra-thin tunneling oxide film and a boron-doped poly-si layer, which are fabricated by a four-step process at the rear planar surface of c-si wafer. First, the growth of tunneling oxide layer (SiO 2) is optimized by one-step Nitric Acid Oxidation of Silicon (NAOS) cleaning. To remove the native oxide, the c-si wafer is dipped in 0.55% HF for 4 min. One-step NAOS is then used by 69.5% room temperature HNO 3 immersion for 1 hour to form
 technique.")
32 stable tunneling oxide approximately 15 Å-thick on both sides of the wafer, followed by 5 min DI water rinse. The second step is the intrinsic amorphous silicon deposition by means of low-pressure chemical vapor deposition (LPCVD) technique. Tempress LPCVD tube furnace in EKL lab is used to deposit 250 nm-thick intrinsic a-si on top of the SiO 2 layer on both sides of the wafer, with the conditions of temperature of 580 C, pressure of 150 mtorr and SiH 4 gas flow of 45 sccm. Third, an ex-situ single-side doping process is achieved by ion-implantation step. Varian Implanter E500HP is used to implant B atoms into the a-si layer to form a doped layer. The implantation energy is 5 kev and dose is ion/cm 2. Junction depth in this case is in the order of 10 nm. Finally, 950 C high-temperature N 2/O 2 atmosphere annealing is used to activate and drive-in the dopants to diffuse into a-si layer and even form small doping tail within the c-si bulk which is necessary for an effective carrier transport through the tunneling oxide layer [39]. Moreover, annealing treatment crystallizes a-si into poly-si film. Below are B-doping profiles measured by ECV (electrochemical capacitance-voltage) profiling with optimal implantation energy of 5 kev and dose of ion/cm 2 and annealing temperature of 190 C in Figure 2.1. Figure 2.1: B-doping profile on 250 nm poly-si passivating contacts (5 kev implantation energy, ion/cm 2 dose and annealing at 950 C in N2/O2 atmosphere). Measured by ECV. For p-type poly-si passivating contacts, the optimal passivation quality is achieved with τ eff = 4.5 ms, J 0 = 14.2 fa/cm 2 and iv OC = 711 mv, which is excellent enough for rear emitter. Therefore, further improvement is not the prior task for this thesis. 24

33 2.1.2 Heterojunction front surface field To minimize the front external reflection and improve the light scattering in the absorber, random pyramidal texturing is employed. Based on anisotropic etching, <100> oriented c-si wafers front surface is preliminary randomly textured by 5% TMAH solution with 120 ml ALKA-TEX. FREE for 20 min, forming <111> oriented upright random pyramidal surface in several microns size (see Figure 2.2). While the rear poly-si surface is protected by 200 nm-thick SiN x capping layer which is hardly etched by TMAH solution. Then three-steps Nitric Acid Oxidation Cycle (NAOC) cleaning in EKL cleaning line is used to remove contamination in the wafer surface. 99% room temperature HNO 3 solution is used for 10 min to remove organic contamination, followed by 5 min DI water rinse. Next, 69.5% HNO 3 solution at 110 C for 10 min followed by 5 min DI water is to clean the metallic residues. Finally, 0.55% HF dip is used to remove chemical oxide layer for 4 min followed by 5 min DI water. The NAOC cleaning is applied for 1-3 times to provide more effective surface cleaning which can avoid any contamination inducing passivation degradation. Figure 2.2: Front surface morphology after 20 min random pyramidal texturing in a solution of 5% TMAH with 120 ml ALKA-TEX. FREE. Taken in SEM. Afterwards, the wafer is transferred swiftly to Amor chamber for depositing intrinsic and n-type a-si:h films on the textured front side by radio frequency plasma-enhanced chemical vapor deposition (RF-PECVD) technique. To avoid any cross-contamination from deposition chamber, H 2 plasma treatment is used and the substrate holder is covered by 100 nm intrinsic a-si:h to prevent contamination from the holder. After placing the wafer into Amor chamber, 30 min preheating is used to heat the sample to set temperature value. Pure SiH 4 gas is used to deposit intrinsic a-si:h film, and together with the precursor gases of hydrogen-diluted PH 3, n-type 25
34 a-si:h layer is formed. Silicon epitaxial growth during intrinsic a-si:h deposition should be avoided to ensure an atomically sharp interface between c-si and intrinsic a-si:h layer [51]. Moreover, low-damage plasma process should be optimized and controlled to obtain a high passivation quality. The deposition conditions (chamber pressure, power of plasma and substrate temperature) and precursor gas properties (precursor gas content and ratio) are of great significance for the opto-electrical properties and passivation quality of a-si:h layers [52], [53] Front transparent conductive oxide To solve issue with lateral conductivity of electrons to metal electrodes, front transparent conductive oxide (TCO) film is deposited on top of the a-si:h layer. RF sputtering is used to deposit TCO layers in Zorro instrument. As a physical vapor deposition (PVD) technique, TCO films are deposited on the wafer by the impingement of energetic Ar ions to TCO material targets. Typically, 75 nm TCO layer is sputtered to provide antireflective effect based on destructive interference principle, which can decrease external reflection further in addition to the textured surface design. The most important features of this layer are to ensure high conductivity to improve FF, but also high transparency to minimize the parasitic absorption loss thus obtaining high J SC Front and rear metal contacts Metallization, as the last process step, is carried out to deposit 6 μm Al at the front textured surface and 200 nm Ag 30 nm Cr 2 μm Al at planar rear side. Aluminum (Al) is used as the main conductive layer due to the reasonably high conductivity and cheap price. Silver (Ag), as the most conductive metal, is deposited at the rear side as the first metal layer because of the low contact resistance between poly-si and Ag interface and back reflection effect. The thin chromium (Cr) film is provide as the intermediate layer to prevent Ag and Al from mixing together during high temperature annealing. As PVD techniques, thermal evaporation and e-beam evaporation are chosen which mainly depends on the melting point of metal. Ag is deposited by thermal evaporation technique that is designed for evaporating relatively low melting point materials. With applying high voltage to a tungsten boat, the temperature increases up to the melting point of 962 C for Al. Then Ag is evaporated and deposited at the wafer surface. Al and Cr are deposited by e-beam evaporation. The mechanism is that high kinetic energy electron beams impinge the Al or Cr material on the crucible and convert the kinetic energy into thermal energy that melts the Al or Cr to evaporate to the wafers. E-beam 26


 carrier-selective passivating rear emitter (SiO2/p poly-si); (b) heterojunction front")

35 evaporation is primarily designed for evaporating the materials with high melting point, such as Cr with melting point of 1907 C. Although Al has a rather low melting point of 660 C, it can form alloy with the tungsten boat that leads to tungsten boat ate by the melted Al if thermal evaporation is used. Thus e-beam evaporation is used for Al deposition. Two hybrid solar cells with different metal patterns are shown in Figure 2.4. Entire process flow is shown in Figure 2.3. TCO (a) (b) (c) (d) Figure 2.3: Process flowchart of hybrid solar cells: (a) carrier-selective passivating rear emitter (SiO2/p poly-si); (b) heterojunction front surface field (i/n a-si:h); (c) front transparent conductive oxide (TCO); (d) front and rear metal contacts. DIE cell (a) (b) Figure 2.4: Pictures of hybrid solar cells with two different metal pattens fabricated in the facility of PVMD group at Delft University of Technology. A wafer consists of four DIE cells in the middle. (a) 2.8 cm 2.8 cm DIE cell with busbas in the middle; (b) 3 cm 3 cm DIE cell with busbar at the edge. 27
36 2.2 Opto-electrical properties of films and devices In this section, the methods for films and solar cells characterization will be introduced in terms of optical and electrical properties. To evaluate and monitor the passivation quality of wafers and solar cells, Quasi-Steady-State Photoconductance measurement is used. Hall effect measurement and four-point probe method are used to investigate the electrical properties of TCO films. Reflectance and transmittance measurement are used to characterized the optical properties of TCO films and solar cells. For device characterization, illuminate J-V and external quantum efficiency are used Quasi-Steady-State Photoconductance (QSSPC) measurement Quasi-Steady-State Photoconductance (QSSPC) measurement is a contactless characterization technique for passivation quality, as a step by step monitoring tool during solar cells fabrication, which is measured by Sinton WCT-120 Lifetime Tester. The principle of QSSPC is by using infrared light flash the excess carriers are created on the sample which increases the conductance of the sample. The photoconductance can be sensed by a contactless coil circuit underneath the instrument stage and the intensity of the flash can be measured by light sensor incorporated in the stage. Considering equal number of electrons and holes generated, the excess photoconductance (σ L) of a n-type wafer is proportional to excess minority carrier density and mobilities of electrons and holes, σ L = q p(μ n + μ p )W (2.1) where q is the elementary charge, Δp is excess minority carrier hole density, μ n and μ p are the mobility of electrons and holes respectively and W is the sample thickness. A measurement of the photoconductance is therefore, a nearly direct way of probing for the excess carrier density. Minority carrier lifetime can be analyzed according to continuity equation then. Since the uniform distribution of excess carriers is assumed and no external electrical field exists, the transport equation for n-type wafer can be simplified G p = d p τ eff dt (2.2) where G is photogeneration rate of charge carriers. The effective minority carrier lifetime (τ eff) is 28
37 τ eff = p G d p dt (2.3) Based on the range of minority carrier lifetime, two methods were employed. One is the Quasi-Steady-State (QSS) mode for low lifetime samples of less than 100 μs. Under this condition, G d p, the lifetime in Equation 2.3 can be reduced to dt τ eff = p G (2.4) When carrier lifetime is larger than 100 μs, the transient mode is used. At this circumstance, as the excess carrier generation rate G is less pronounced and assumed to be zero, the lifetime then becomes τ eff = p d p dt (2.5) Since the lifetime of samples fabricated in this thesis exceeds 600 μs, transient model is used. Effective lifetime is a function of the excess minority carrier concentration and a typical graph of FZ n-type c-si wafer passivated by 20 nm intrinsic a-si:h layer on both sides was shown in Figure τeff at Δ = cm -3 eff (ms) Minority carrier density (cm -3 ) Figure 2.5: Effective minority carrier lifetime of FZ n-type c-si wafer passivated by 20 nm i a-si:h on both sides after 190 C annealing in air for 30 min as a function of excess carrier density. 29
38 At high injection levels, the minority carrier lifetime is limited by Auger recombination. Moreover, implied open circuit voltage (iv OC) can be deduced based on the excess carrier density measurement, which is due to the splitting of the quasi-fermi level depending on the excess charge carrier density [54]. For n-type wafers, the implied open circuit voltage at one-sun illumination can be expressed by iv OC = k BT ln q ( n(n D+ n) n2 ) (2.6) i where k B is Boltzmann constant, T is temperature, Δn is excess minority carrier electron density, N D is concentration of donors and n i is intrinsic concentration of carriers Hall effect measurement Ecopia HMS-5000 Hall Effect setup is the instrument for characterization of carrier density, mobility and resistivity of TCO thin films. The theoretical basis underlying the Hall effect measurement is Lorentz force and Van der Pauw technique. The sample is placed perpendicular to an applied magnetic field on the sample board connecting with four point probes at the corners. When a fixed current flows through the sample, electrons experience a magnetic force and are subject to flow towards to the sample side. The charge difference results in a voltage drop across the sample, so-called Hall voltage (V H). By measuring the Hall voltage (V H) and resistivity (ρ) via van der Pauw technique, the carrier density N and mobility μ can be determined by N = IB q V H (2.7) μ = V H IBρ (2.8) where I is the fixed current passing through the sample, B is the magnetic field and q is the elementary charge. For best results, the samples should be square in shape and normally 10 mm 10 mm is preferred in size. 30
 with upper cooling reservoir; (b) zoom-in of sample stage. (b) 2.")

 is then determined by R sheet = π ln2 (V I ) (2.")
39 Liquid nitrogen tank Temp sensor Magnet lid Sample board (a) Figure 2.6: Sample mounting fixture: (a) with upper cooling reservoir; (b) zoom-in of sample stage. (b) Four-point probe Sheet resistance of TCO films was measured by means of a four-point probe apparatus, which consists of four equally spaced tungsten metal tips. By applying a current flow through two outer probes, the voltage across the inner voltage probes can be measured. The sheet resistance (R sheet) is then determined by R sheet = π ln2 (V I ) (2.9) where V is the voltage across the inner voltage probes, I is the current across two current probes and π/ln 2 is a geometric factor of a semi-infinite thin sheet, which equals to Figure 2.7: Schematic sketch of four-point probe measurement. 31
40 2.2.4 Illuminated J-V Illuminated J-V measurement is realized by measuring the current of the solar cell with a range of applied voltage under standard test conditions (STC) 1, which is achieved by AAA class Wacom WXS 156S solar simulator. The main external solar cell parameters are obtained from illuminated J-V measurement: short circuit current density (J SC), open circuit voltage (V OC), fill factor (FF) and conversion efficiency (ɳ). Besides, other important parameters of maximum power (P max), series resistance (R s) and shunt resistance (R sh) can be determined as well. The typical illuminated J-V characteristic of hybrid solar cell is shown in Figure 2.8. The short circuit current density J SC is defined as current per unit area that flows through the external circuit at short circuit condition, which is also the maximum current density delivered by a solar cell. J sc of a solar cell depends on the photon flux incident on the solar cell, which is determined by the spectrum of the incident light. Therefore, before solar cell measurement, two reference cells of Fraunhofer Institute for Solar Energy Systems were used to calibrate. In hybrid solar cells, J SC strongly relys on the optical properties, such as the absorption in the absorber layer (c-si bulk) or parasitic absorption losses in the TCO, a-si:h films and poly-si layer and surface reflection. The open circuit voltage V OC is the maximum voltage that a solar cell can deliver when no current flows through the external circuit. V OC depends on the photo-generated current density and saturation current density of a solar cell, as described in Equation 2.10, V OC = k BT ln q (J ph + 1) (2.10) J 0 where J ph is the photo-generated current density and J 0 is the saturation current density. Since J 0 describes the recombination state in the solar cell, excellent passivation quality gives a low value of J 0 thus leading to a high V OC. In hybrid solar cells, V OC is limited by the passivation quality of a-si:h layers and rear poly-si although typically a V OC exceeding 700 mv can be measured. The fill factor (FF) is the ratio of the maximum power (P max) to the product of V OC and J SC. P max = V mpp J mpp (2.11) FF = P max V OC J SC (2.12) 1 Standard test conditions (STC) are defined as the solar irradiation of 1000 W/m 2 under AM 1.5 spectrum illumination and the constant solar cell temperature of 25 C. 32
41 Power (W) where V mpp and J mpp are the voltage and current at the maximum power point (MPP) respectively. In practice FF is strongly influenced by the series resistance R s and the shunt resistance R sh. For hybrid solar cells, the series resistance comes from three main parts: (1) the movement of carriers though the a-si:h layers, TCO and the bulk itself; (2) the contact resistance between the interfaces, such as a-si:h/tco and TCO/metal heterointerface; (3) the resistance of the top and rear metal contacts. And the shunt resistance is primarily caused by the leakage across the p-n junction around the edge and the crystal defects, pinholes or impurity precipitates. Lower series resistance and higher shunt resistance lead to higher FF. The conversion efficiency ɳ is then defined as the ratio between the maximum power generated and the incident power P in, which is equal to 1000 W/m 2 at STC. η = V OCJ SC FF P in (2.13) JSC MPP 0.30 Current density (ma/cm 2 ) Jmpp Pmax Voltage (V) Vmpp VOC JSC 0.00 Figure 2.8: Illuminated J-V curve (black) and power output (blue) of 9 cm 2 hybrid solar cell under AM 1.5 illumination Reflectance, transmittance and absorbance Reflectance (R) and transmittance (T) of TCO films and solar cells were measured by PerkinElmer Lambda 950 spectrophotometer to provide optical properties of the materials. 33
 internally coated with Spectralon, which is a highly reflective material. The optical design of 150 mm IS is shown in Figure 2.9.")
42 With the tungsten-halogen lamp and deuterium light source, a wide range of UV/visible/NIR spectra from 175 nm to 3300 nm is provided. The main component is a 150 mm-diameter integrating sphere (IS) internally coated with Spectralon, which is a highly reflective material. The optical design of 150 mm IS is shown in Figure 2.9. By placing the sample in the transmittance sample holder at the entrance of the sphere or reflectance sample holder at the rear side, either transmitted or reflected light from the sample can be measured by optical detector, which is then compared with the reference beam to obtain the actual transmittance and reflectance respectively. Two optical detectors are used to measure the light intensity and they change the measurement point at the wavelength of 860 nm, therefore there is a small turbulence observed in R and T curves. Before the sample measurement, the calibration consisting of 0% reference signal and 100% reference signal is carried out to rule out any influence from outside light. The absorbance (A) then can be calculated by 1-R-T. Figure 2.9: Top view of 150 mm integrating sphere (IS) and its optical design [55] External quantum efficiency The external quantum efficiency (EQE) is the ratio of the number of the charge carriers successfully collected to the number of the photons incident on the solar cell. Since it is wavelength dependent, the monochromatic light of wavelength λ 0 is used to illuminate the solar cell and generate the photocurrent I ph. Then EQE is determined by 34

43 EQE(λ 0 ) = I ph(λ 0 ) q Φ ph (λ 0 ) (2.14) where q is the elementary charge and ϕ ph is the photon flux incident on the solar cell. An in-house EQE setup is used and shown in Figure W Xenon arc lamp is used to emit a broad wavelength spectrum and the light is then pass through the optical chopper to modulate the intensity. Modulated light is send through filters and into an Oriel monochromator to generate a monochromatic light output. The output beam is finally focused by several lenses to a well-defined 3 mm 2 area on solar cell sample placed in the sample holder. With the metallic probes connected to the solar cell front and rear electrodes, the photo-generated current can be measured. The digital lock-in amplifier is used to isolate the signal from background noise, control the optical chopper. Combining the photon flux ϕ ph at a certain wavelength with the EQE measured, J SC of a hybrid solar cell is then calculated by J SC = q EQE(λ)φ(λ)dλ (2.15) Here only the spectral wavelength range from 300 nm to 1200 nm is chosen because the spectral power density of AM 1.5 is nearly zero below 300 nm and rare photos are absorbed by c-si after 1200 nm wavelength due to the bandgap. In hybrid solar cells, both optical losses, such as parasitic absorption and reflection, and recombination loss have impact on the EQE spectrum. Low-noise preamplifier Chopper controller Power supply/amplifier Sample holder 8 bias lights Monochromator Lock-in amplifier Figure 2.10: In-house EQE steup in PVMD group. 35
44
45 3 Influence of Intrinsic/n-type a-si:h Layers on Hybrid Solar Cells 3.1 Introduction In order to suppress the surface recombination of c-si, intrinsic and n-type hydrogenated amorphous silicon (a-si:h) layers are used as front surface field (FSF) on hybrid solar cells. Intrinsic a-si:h provides an excellent chemical passivation to c-si surface, which improves the V OC well above 700 mv compared to the structure without intrinsic layer [25], [56]. And n-type a-si:h induces an internal electrical field that creates high band bending at the interface. This provides field-effect passivation to repel the holes away. As the band diagram shown in Figure 3.1, when the electrons transport to the interface, with the aid of tunneling and/or thermionic emission, the band offset of ΔE C can be overcome and the electrons then flow into n-type a-si:h layer [57]. While the energy barrier for holes is much larger, they are less likely to pass through the a-si:h layers. So a-si:h behaves as a prominent carrier-selective passivating contact. To ensure effective electrons transport into a-si:h, the activation energy E a of n-type a-si:h film should be as low as possible and the suitable value of E a is around 0.2 ev [58], [59]. However, the drawback for the application of a-si:h as FSF is that it causes the parasitic absorption in the short wavelength. This is because a-si:h is a direct bandgap material with the optical bandgap of approximately 1.7 ev, which absorbs the UV and visible light strongly compared to c-si [39]. The absorption coefficient of a-si:h is much larger than that of c-si when the wavelength is less than 700 nm as depicted in Figure 3.2. It also was reported that the collection efficiency of carriers generated in n-type a-si:h layer is zero and only 30% absorbed light in intrinsic a-si:h
![layer contributes to J SC [50]. The parasitic absorption of a-si:h limits the J SC to a higher level.](/docs-images/80/81166148/images/46-0.jpg "Another limitation of the application of a-si:h passivating contacts is the lack of thermal stability during high-temperature process (such as contact firing after industrial screen printing).")
![Typically, low temperatures below 200 C are used for processing a-si:h/c-si based SHJ solar cells to avoid any thermal damage to a-si:h layers [31], [34], [43]. Figure 3.](/docs-images/80/81166148/images/46-1.jpg "1: Schematic band diagram of a-si:h (n)/a-si:h (i)/c-si (n) structure.")
46 layer contributes to J SC [50]. The parasitic absorption of a-si:h limits the J SC to a higher level. Another limitation of the application of a-si:h passivating contacts is the lack of thermal stability during high-temperature process (such as contact firing after industrial screen printing). Typically, low temperatures below 200 C are used for processing a-si:h/c-si based SHJ solar cells to avoid any thermal damage to a-si:h layers [31], [34], [43]. Figure 3.1: Schematic band diagram of a-si:h (n)/a-si:h (i)/c-si (n) structure Absorption coefficient LPCVD poly-si 10 1 PECVD a-si:h c-si Wavelength (nm) Figure 3.2: Absorption coefficient of PECVD a-si:h, LPCVD poly-si and c-si. Plasma-enhanced chemical vapor deposition (PECVD) is a mature technique for a-si:h growth. Silane (SiH 4) is a widely used gas precursor for a-si:h deposition. By introducing phosphine 38
47 (PH 3) or diborane (B 2H 6) gas, intrinsic, n- or p-type a-si:h can be obtained. The deposition conditions (chamber pressure, power of plasma, substrate temperature and gas flow) and material properties (precursor gas content and ratio) are of great significance to the opto-electrical properties and passivation quality of a-si:h layers [52], [53], [60], [61]. To obtain a good passivation quality, deposition conditions should be optimized to obtain low-damage plasma deposition process. And silicon epitaxial growth during intrinsic a-si:h deposition should be avoided to ensure an atomically sharp interface between c-si and intrinsic a-si:h layer [51]. Besides, cleaning procedure is of great importance to obtain excellent surface passivation to c-si wafer [62], [63]. This is usually achieved by wet-chemical process. Moreover post-deposition annealing improves passivation quality dramatically even in air environment, but the moderate temperature is highly preferred [64], [65]. In this chapter, the cleaning procedures were first investigated as an initial but crucial step for passivation quality. Then post-deposition annealing as an effective passivation method was studied in terms of annealing temperature, time and environment. Finally, the effect of intrinsic and n-type a-si:h layers thickness on the electrical property of symmetric structures were carried out, along with the opto-electrical performance on hybrid solar cells. 3.2 Passivation of i/n a-si:h stacks and performance on solar cells (a) (b) (c) Figure 3.3: Schematic sample structures on n-type c-si FZ wafer: (a) symmetric structure with i/n a-si:h layers on both-side textured surfaces; (b) a precursor cell with i/n a-si:h layers on front textured surface and SiOx/poly-Si films on rear flat surface; (c) a complete hybrid solar cell. Figure 3.3 shows three different experiment samples: (a) symmetric structure of a-si:h(n) /a-si:h(i)/c-si/a-si:h(i)/a-si:h(n); (b) precursor cell of a-si:h(n)/a-si:h(i)/c-si/sio x/poly 39
48 -Si(p); and (c) finished hybrid solar cell with front TCO and metal. High quality n-type FZ wafers with (100) orientation, low resistivity of 1 5 Ω cm and thickness of 280 μm were used to fabricate symmetric passivation test structures and hybrid solar cells. To prepare the symmetric structure as illustrated in Figure 3.3 (a), the following steps were employed: 1. Texturing: 5% TMAH (4 L H 2O and 1 L 25% TMAH) and 120 ml ALKA-TEX. FREE solution for 20 min, then DI water rinse for 5 min and dry in the spin dryer; 2. NAOC (Nitric Acid Oxidation Cycle) cleaning: 99% room temperature (RT) HNO 3 for 10 min followed by 5 min DI water rinse to remove organic contaminants, then 69.5% HNO 3 at 110 C for 10 min followed by 5 min DI water to clean the metallic residues, finally 0.55% HF dip for 4 min to remove oxide layer. The NAOS cleaning may repeat 1-3 times to provide effective surface cleaning, but after the first time entire NAOS cleaning, the first 99% RT HNO 3 immersion for 10 min and 5 min DI water rinse can be skipped in following NAOS cleaning; 3. RF-PECVD: after NAOS cleaning, the wafers should be transferred swiftly to vacuum environment in Amor chamber to prevent from surface oxidation. After preheating for 30 min, i/n a-si:h layers were deposited at the same deposition chamber on both sides. The deposition conditions of i/n a-si:h layers are shown in Table 3.1. For precursor cells and hybrid solar cells as depicted in Figure 3.3 (b) and (c), the fabrication steps are as follows: 1. Rear emitter (tunneling oxide and p-type poly-si): Tunneling oxide: 0.55% HF dip for 4 min to remove native oxide; then 69.5% room temperature HNO 3 immersion for 1 h to form around 15 Å tunneling oxide Heavily-doped p-type poly-si: 250 nm thick intrinsic a-si layer deposition by Low Pressure Chemical Vapor Deposition (LPCVD); boron implantation with E=5 kev and D= ion/cm 2 to form doped film; 950 C high-temperature N 2/O 2 atmosphere annealing to activate, drive-in dopants and crystallize a-si SiN x capping on poly-si side to prevent from etching during texturing process 2. Texturing and front surface field (i/n a-si:h layers): the same processes as symmetric structures described above (Precursor cells were finished); 3. TCO sputtering: 65 nm IO:H capped by 10 nm ITO deposited by RF-sputtering on textured front surface. The detailed deposition conditions were shown in Table 4.1; 4. Front and rear metal contacts: 6 μm Al evaporated at front textured surface and 200 nm Ag 30 nm Cr 2 μm Al evaporated at planar rear side. Passivation quality was evaluated by Sinton WCT-120 Lifetime Tester based on transient mode. The values of τ eff and iv OC were reported when the minority carrier density (MCD) is cm -3 40
49 with optical constant of 0.7. The illuminated J-V curve of hybrid solar cells was measured by AAA Wacom solar simulator and pff was measured by Sinton Suns-V OC stage. The EQE and R/T measurement were carried out by an in-house application and Lambda 950 spectrophotometer respectively. Table 3.1: Deposition conditions of intrinsic and n-type a-si:h in Amor i a-si:h n a-si:h Amor chamber 2 2 SiH 4 (sccm) PH 3 (2% in H 2) (sccm) - 40 P deposition (mbar) T substrate ( C) T hearter ( C) P RF, measure (W) Importance of cleaning procedures NAOS number of cycles It is of great importance to ensure effective surface cleaning for c-si before i/n a-si:h deposition, especially after the TMAH texturing process since it induces contaminations and micro-roughness on the surface [66]. Passivation measurements were used as main indicators to evaluate the effectiveness of cleaning on symmetric structures with 4.5 nm intrinsic a-si:h and 6 nm n-type a-si:h layer deposited on double-side textured c-si wafers. The only variable is the NAOC cleaning time: 1 NAOC, 2 NAOC and 3 NAOC. Figure 3.4 shows effective lifetime improves with NAOC cleaning times increasing from 1.3 ms for 1 NAOC to 4.8 ms for 3 NAOC on as-deposited samples. After 190 C 30 min annealing on oven, the lifetime boosts dramatically and this increment is most evident for three-time NAOC cleaning with high lifetime of 12.6 ms. Since the NAOC cleaning is time-consuming which takes at least 40 min for one round, 1 NAOC was used for all symmetric structure passivation tests and 3 NAOC is considered to be effective for high-efficiency solar cell fabrication. 41
50 14 12 As-deposited 190 C 30min 10 eff (ms) x1 NAOC x2 NAOC x3 NAOC Figure 3.4: Effective minority carrier lifetime (Δ=10 15 cm -3 ) on symmetric structures with different NAOC cleaning times. Plasma cleaning of chamber and plasma deposition on holder Two precursor cells were prepared to evaluate the chamber cleaning and holder deposition issues. Tunneling oxide capped with boron-implanted poly-si of 250 nm thickness was formed as rear emitter. Then 7 nm/6 nm i/n a-si:h stacks were deposited at the front textured surface as FSF. No chamber cleaning and substrate holder deposition was applied to first sample before PECVD deposition, while for the second sample, 20-minute hydrogen plasma treatment (60 W power plasma with 200 sccm H 2 flow) was used to clean the chamber and the substrate holder was covered by 100 nm intrinsic a-si:h. The improved passivation quality, in Figure 3.5, reveals both cleaning processes are inevitable for high quality a-si:h passivating contacts. The lifetime increases from 3.5 ms to 5.3 ms with iv oc of 709 mv after cleaning. This is due to that boron or phosphorus adhered to the chamber wall or substrate holders can be unintentionally deposited into the subsequent intrinsic or doped layers and induce more recombination centers. This can be even worse when intrinsic and n-type a-si:h are deposited in the same chamber and the substrate holders are not used separately for different doped layers deposition in available facilities. The same effect was reported in other groups that this cross-contamination would deteriorate passivation quality [44], [67]. 42
51 7 6 Lifetime ivoc 25.2 fa/cm eff (ms) ivoc (mv) fa/cm No cleaning Chamber / holder cleaning 695 Figure 3.5: Lifetime (Δ=10 15 cm -3 ), ivoc and J0 measurements on precursor cells (7/6 nm i/n a-si:h stacks as FSF) without/with chamber cleaning and holder deposition. Measured after 190 C 30 min annealing on oven Effect of post-deposition annealing Post-deposition annealing is an effective method to improve passivation quality of as-deposited samples with a-si:h structures, which is considered to reform the structure stability and eliminate the dangling bonds in the structure [43], [64], [68]. Symmetric structures in Figure 3.3 (a) of 4.5/6 nm i/n a-si:h layers were prepared on double-side textured c-si wafers after 1 NAOC cleaning. Passivation quality on three different annealing temperatures of 150 C, 190 C and 230 C were investigated in 1 h annealing periods on oven. Effect of annealing temperature and time As revealed in Figure 3.6, post-deposition annealing highly improves passivation quality of i/n a-si:h stacks compared to as-deposited samples at three different temperatures, no matter the annealing temperature is higher or lower the deposition temperature of 180 C. This may be due to the hydrogen diffusion in the structure, especially into the a-si:h/c-si interface [64], [69], [70]. The annealing may activate diffusion of weakly bonded hydrogen and this dissociative hydrogen passivates the dangling bonds further at the interface and decreases the recombination. The temperature of 230 C gives the best lifetime of 5.81 ms in 10 min short-period annealing. While if the annealing goes on further, passivation quality deteriorates quickly to 4.15 ms in 50 min, which is much lower than 5.39 ms lifetime measured in 190 C annealing in the same period. This may relate to the high annealing temperature causes 43
52 hydrogen effusion from the heterointerface or amorphous silicon layers and generates more dangling bonds as defective recombination centers [64]. Passivation quality almost saturates for 150 C and 190 C annealing after 30 min with 3.6 ms and 5.3 ms respectively, which is good for saving more fabrication time. Moderate temperature may not pose threat on the passivation even for long annealing period because stable structure is already formed and not changed dramatically at this temperature point. 6 5 eff (ms) Annealing time (min) 150 C 190 C 230 C Figure 3.6: Lifetime at Δ=10 15 cm -3 and implied-voc as the functions of post-deposition annealing time and temperature on symmetric structures with fixed 4.5/6 nm i/n layers. The annealing was carried out in air environment on oven. Moreover, passivation stability after post-deposition annealing is of great importance to be investigated since after i/n a-si:h deposition, the cells are far from finished. Typically, 48 more hours are required to finalize front TCO sputtering, photolithography, metallization and lift-off process, therefore possible degradation after i/n post-deposition annealing should be evaluated. As shown in Figure 3.7, highest lifetime values were obtained after post-deposition annealing with 5.56 ms for 190 C and 5.80 ms for 230 C. There is obvious passivation degradation after 48h for both annealing temperatures, which may relate to the hydrogen effusion during the cooling down stage after thermal annealing. However, higher temperature of 230 C leads to even worse degradation which may be caused by unstable structure and weak Si-H bonds formed during post-deposition annealing. At the initial period within 10 min, hydrogen diffuses fast and passivates the dangling bonds, while due to high temperature, some hydrogen atoms stay active and may dissociate from the bonding state and increase the defect density. High 44
53 temperature causes this dynamic balance toward to desorption state and large portion of dangling bonds are formed which deteriorates passivation quality. To obtain a well passivated surface after post-deposition annealing and following cooling down, 190 C 30 min annealing was chosen as optimal treatment after i/n a-si:h deposition. 7 6 As-deposited Post-annealing Degradation after 48h 5 eff (ms) C 230 C Annealing temperature ( C) Figure 3.7: Lifetime at an injection level of Δ=10 15 cm -3 on symmetric structures with 190 C and 230 C annealing temperatures at three different stages: as-deposited, post-deposition annealing and degradation after 48h. Effect of annealing environment: Air or H 2 flow Post-deposition annealing benefits passivation quality significantly in ambient air environment [52], which was also confirmed in aforementioned experiments. Considering hydrogen plays important role in chemical passivation, one question comes out: Does passivation quality improve further if H 2 flow is provided during post-deposition annealing process? Two experiments were carried out on precursor cells with 3.5 nm i layer and 6 nm n layer as FSF via changing post-deposition annealing environment: one cell was annealed in 190 C ambient air for 30 min on oven, the other was performed under 200 sccm H 2 flow for 30 min on 180 C Amor chamber. The results on precursor cells shows that H 2 flow annealing has better passivation quality which 45
54 improves the lifetime by 1.2 ms and reduce J 0 dramatically by 12 fa/cm 2. This is due to more free hydrogen atoms are replenished and can penetrate easily into a-si:h film or even a-si:h/c-si heterointerface to passivate the defects and reduce the defect density. 6 5 Lifetime ivoc eff (ms) fa/cm ivoc (mv) fa/cm Air H2 flow 695 Annealing environment Figure 3.8: Lifetime (Δ=10 15 cm -3 ), ivoc and J0 measurements on precursor cells (3.5/6 nm i/n stacks as FSF) in ambient air and H2 annealing environment. Air annealing condition is 190 C ambient air for 30 min on oven and H2 annealing is 200 sccm H2 flow for 30 min on 180 C Amor chamber Thickness optimization of i/n a-si:h stacks To investigate the effect of thickness of intrinsic and n-type a-si:h, symmetric structures were used first due to the simple process and effective passivation indication for i/n a-si:h stacks. Then the solar cells were fabricated to analyze the influence on opto-electrical properties. Effect of n-type a-si:h layer thickness Since n-type a-si:h induces effective band bending at the interface and provides field-effect passivation, it has a significant impact on the performance of solar cells. Under the deposition conditions described in Table 3.1, 40 sccm SiH 4 and 11 sccm PH 3 (2% in H 2 flow) as precursor gases for n-type a-si:h growth, activation energy of ev was obtained with 30 nm n-type a-si:h layer capped with 300 nm Al film to provide effective conduction on glass sample. This activation energy value corresponds to the ideal reference values reported in other groups to form excellent n-type a-si:h in terms of the carrier transport [52]. Therefore, the deposition 46
55 conditions were kept unchanged for n-type a-si:h. Figure 3.6 reveals that 6 nm n-type a-si:h shows excellent lifetime of 5.6 ms and implied-v OC of 707 mv, which is at the same passivation level of 7 nm a-si:h. The saturation of passivation quality indicates that it has no motivation for a thicker n-type a-si:h than 6 nm. eff (ms) ivoc (mv) n a-si:h thickness (nm) 699 Figure 3.6: Effect of n-type a-si:h thickness on lifetime (Δ=10 15 cm -3 ) and ivoc. Measured on symmetric structures with fixed 4.5 nm i a-si:h and different n a-si:h thickness after 190 C 30 min annealing on oven. Effect of intrinsic a-si:h layer thickness Figure 3.7 presents the impact of different intrinsic a-si:h thickness on main passivation indicators τ eff, J 0 and iv OC of symmetric structures shown in Figure 3.3 (a). The lifetime and iv OC both increase significantly and J 0 decreases dramatically with a thicker i a-si:h layer. The distinct change happens at the structure with 4.5 nm thick i a-si:h. At 4 nm-thick intrinsic a-si:h, J 0 is still quite high of fa/cm 2 while it dopes quickly to fa/cm 2 at 4.5 nm thickness and almost keep the same level of 13 fa/cm 2 at 7 nm-thick i layer. The same trend was also revealed in implied-v OC curve which shows 702 mv, 707 mv and 708 mv for 4 nm, 4.5 nm and 7 nm respectively. The reason of improving passivation can be explained that more dangling bonds are passivated at the interface and lower surface defect density with thicker i a-si:h layer. 47
56 eff (ms) 5 4 J 0 (fa/cm 2 ) ivoc (mv) i a-si:h thickness (nm) i a-si:h thickness (nm) i a-si:h thickness (nm) (a) (b) (c) Figure 3.6: The effect of intrinsic a-si:h thickness on: (a) minority carrier lifetime τeff (Δ=10 15 cm -3 ); (b) saturation current density J0 and (c) ivoc. Measured on symmetric structures with a series of thickness of intrinsic a-si:h: 3.5 nm, 4 nm, 4.5 nm, 7 nm and 8 nm, and fixed 6 nm n-type a-si:h after 190 C 30 min annealing on oven. While there is a trade-off between parasitic absorption and passivation quality in terms of the thickness of intrinsic a-si:h layer on hybrid solar cells. This contradiction was clearly indicated in Figure 3.7. J SC is lower when the i a-si:h layer becomes thicker, from ma/cm 2 at 3.5 nm i layer to ma/cm 2 at 7 nm. The reason may be attributed to more parasitic absorption caused by thicker i a-si:h layer. When the light travels through the front nonactive layers, intrinsic a-si:h layer will absorb the photons with higher energy than its bandgap of around 1.7 ev, or wavelength less than 730 nm according to Lambert-Beer law. While only 30% absorbed light in intrinsic layer contributes to J SC [50], this causes parasitic absorption loss. As EQE curve shown in Figure 3.8, at the short wavelength especially less than 700 nm, the parasitic absorption loss increases with a thicker i layer. On the other hand, V OC improves dramatically from 689 mv to 711 mv with the increasing i layer thickness due to more effective chemical passivation. Moreover, intrinsic a-si:h layer also influences the carrier transport and resistance, thus has an impact on FF. The highest FF of 73.0% was achieved when i a-si:h is in the intermediate thickness of 4.5 nm. Neither thin nor thick i layer deteriorates the FF compared to 4.5 nm. Thicker intrinsic a-si:h layer of 7 nm may reduce the electrons tunneling and hopping Probability that leads to a low FF value of 68.8%. If the intrinsic layer is too thin, a slight decrease of FF also can be obtained. Possible explanations are that: serious defect-rich layer is formed at the initial deposition layer mainly due to the unstable 48
57 plasma, which is even worse when intrinsic layer is too thin. It was reported that defective SiH 2 interface structure may lead to this degradation [71]; not effective passivation and high surface defect density at the c-si surface caused by thinner i layer hinder the carrier transport thus lead to low FF Jsc (ma/cm 2 ) FF (%) Voc (mv) i a-si:h thickness (nm) (%) i a-si:h thickness (nm) Figure 3.7: Characteristics of hybrid solar cells as a function of intrinsic a-si:h thickness. Since the rear side is fully covered by metal, there is no transmission (T) loss for hybrid solar cells. Therefore, 1-R curves show the absorption (A) in hybrid solar cells in Figure 3.8. As an indicator for reflection effect or texturing quality, average reflectance R is defined by R = R(λ)dλ 1200 dλ 300 (3.1) where R is the reflectance, λ is the wavelength. Average reflectance values are at the same level around 8.19% for three hybrid solar cells with different i layer thickness, which is smaller than the values obtained before in our lab [72], [73]. The loss between the 1-R and EQE refers to the recombination loss and parasitic absorption in Figure 3.8. At short wavelength, the main losses come from the parasitic absorption of front 49
58 TCO (IO:H and ITO stacks here) and i/n a-si:h layers, and part is from the recombination losses. Therefore, a-si:h/c-si heterojunction structure has low spectral response in short wavelength range with the EQE value of approximately 0.2 in 300 nm wavelength. At visible wavelength, the recombination loss in c-si absorber is the main loss mechanism, especially the surface recombination due to the unpassivated dangling bonds. The free carrier absorption (part of parasitic absorption) of rear poly-si layer and metal contributes to the loss in the long wavelength, as well as recombination. Through quenching these losses, J SC can be improved further. Comparing the three EQE curves in Figure 3.8, the short circuit current density shows a pronounced increment by decreasing the intrinsic a-si:h thickness from 7 nm i layer to 3.5 nm i film EQE, 1-R (-) R 3.5 nm i 4.5 nm i 7 nm i EQE 3.5 nm i (38.81 ma/cm 2 ) 4.5 nm i (38.68 ma/cm 2 ) 7 nm i (37.49 ma/cm 2 ) Wavelength (nm) Figure 3.8: 1-R and EQE spectra of hybrid solar cells with different intrinsic a-si:h thickness. 50
59 3.3 Conclusion In this chapter, passivation quality on intrinsic ad n-type a-si:h stacks were investigated and relative optimizations were carried out on the hybrid solar cells. First, effective surface cleaning is vital for c-si/a-si:h interface. With increasing NAOC cleaning times and plasma cleaning for chamber as well as substrate holder, the lifetime improves significantly. Besides, optimal post-deposition annealing condition of 190 C 30 min in ambient air was developed. Too high post-deposition annealing temperature as 230 C causes marked passivation degradation for more than 10 min annealing and after 48 h idle treatment, which may be caused by the formation of unstable structure and effusion of hydrogen from the interface. While low annealing temperature suppresses passivation potential and leads to lower lifetime and implied-v OC. And H 2 flow post-deposition annealing on 180 C Amor chamber for 30 min shows more appealing passivation performance which improves the lifetime up to 4.7 ms and mainly decreases the J 0 to 28.7 fa/cm 2 on precursor cell. Furthermore, the thickness of intrinsic a-si:h has significant impact on passivation quality. Effective lifetime and implied-v OC are strictly related to i a-si:h thickness since intrinsic layer provides excellent chemical passivation and more dangling bonds are eliminated when thicker i a-si:h is applied thus lower defect density. Meanwhile, as non-absorber layer, thicker i a-si:h film has more parasitic absorption losses especially within 700 nm wavelength due to its approximately bandgap of 1.7 ev. There is a trade-off between V OC and J SC regarding the i a-si:h layer thickness. Moreover, intrinsic layer influences the carrier transport thus FF. The hybrid solar cell with 4.5 nm i layer presented highest FF of 73%. Thicker i layer of 7 nm prevents the majority carrier electrons from tunneling and hopping into n-type layer which leads to lower FF of 68.8%. On the other hand, possible reasons for slightly lower FF of 71.5% in 3.5 nm intrinsic layer may be attributed to: (1) serious defect-rich interface is formed, such as defective SiH 2 layer mainly due to the unstable plasma at the initial deposition stage, which is even worse when i layer is too thin; (2) not effective passivation and high surface defect density lead to more recombination centers which hinder the effective carrier transport. 51
60
61 4 Influence of IO:H/ITO stacks on Hybrid Solar Cells 4.1 Introduction In silicon heterojunction solar cells (SHJ), a-si:h has a very poor lateral conductivity [18]. In order to suppress any issue with lateral transport of electrons in a-si:h, a transparent conductive oxide (TCO) layer is usually deposited. The most important features of this layer are to ensure high conductivity to guarantee high FF, but also high transparency to minimize parasitic absorption losses. The commonly used TCO are n-type materials where defects such as oxygen vacancies and impurity behave as electron donors [74], which include Sn- or H-doped indium oxide and Al- or B-doped zinc oxide. The resistivity ρ, of TCO materials depends on the charge carrier density N and the carrier mobility μ, shown in following Equation 4.1 ρ = 1 σ = 1 enμ (4.1) where σ is the conductivity and e is the electronic charge (e = C). To obtain a highly conductive TCO material (ρ < 10-3 Ω cm), high carrier density (N > cm -3 ) and mobility (μ > 20 cm 2 V -1 s -1 ) are required. While if carrier density increases to reduce the resistivity, the free carrier absorption (FCA) in the near infrared (NIR) region and reflection for incident light that has lower frequency than the plasma frequency increase relevantly, which lead to low transparency for TCO layer. The relation between carrier density N and plasma frequency ω p is give

 and high transparency (high J SC), high mobility (typically > 100 cm 2 V -1 s -1 ) offers the only way with moderate or low carrier density.")
62 ω p 2 = Ne2 mε 0 (4.2) where ω p is plasma frequency, which refers to the natural frequency of oscillation of the electron gas; m is electron mass and ε 0 is the vacuum permittivity. According to this equation, higher plasma frequency is obtained with higher carrier density of TCO, which will lead to higher reflection of incident light which has lower frequency than plasma frequency. Therefore, to balance the low resistivity (high FF) and high transparency (high J SC), high mobility (typically > 100 cm 2 V -1 s -1 ) offers the only way with moderate or low carrier density. Solar cell performance depends on not only the properties of TCO layer itself, but also the interface between TCO and doped a-si:h layer underneath or even metal. Typically sputtering technique is used for TCO deposition and it causes passivation degradation due to sputter-induced ion bombardment and ultraviolet emission from the plasma [75], [76]. Moreover, work function of n-type TCO layer strongly influences the carrier transport at the TCO/a-Si:H interface, and even the a-si:h/c-si interface when FSF layer is too thin. The performance of the solar cells, especially the V OC and FF, can be influenced significantly [6], [77], [78]. The effect the TCO work function on the band alignment of TCO/a-Si:H (n/i)/c-si structure is shown in Figure 4.1. TCO with too high work function not only induces lower built-in voltage of a-si:h/c-si structure but also forms Schottky barrier at the TCO/a-Si:H (n) interface, which blocks the effective carrier transport and induce the carrier recombination. Ideal TCO work function should be smaller than 4.5 ev to form ohmic contact for a-si:h (n)/tco structure according to the simulation. (a) (b) (c) Figure 4.1: Schematic band diagram illustrating the effect of TCO work function on band alignment at a-si:h (n/i)/c-si (n) structure: (a) without TCO; (b) TCO work function higher than a-si:h (n); (c) TCO work fucntion lower than a-si:h (n). Indium tin oxide (ITO, Sn-doped In 2O 3) is the most used TCO material in silicon heterojunction solar cells due to its low resistivity of Ω cm [79], [80]. The relatively high carrier 54
63 density of cm -3, with rather low mobility of cm 2 /(V s), however, leads to high FCA and reflection in the NIR region [76], [80], [81]. Meanwhile, the parasitic absorption in near UV makes ITO less transparent due to its energy bandgap of around 4 ev [82]. Hydrogen-doped indium oxide (IO:H, hydrogenated indium oxide) is a quite attractive alternative for replacing ITO because of higher transparency and relatively low resistivity [30], [76], [83]. Typically, low resistivity of (3 5) 10-4 Ω cm was achieved with high mobility exceeding 100 cm 2 /(V s) and low carrier concentration less than cm -3 on IO:H samples [30], [79], which reduces the absorption over the complete spectral range, especially in the near IR region [83]. Nevertheless, SHJ solar cells with IO:H perform worse than ITO mainly due to poor contact resistance with metal, which leads to 3% less FF or even more [79]. The specific contact resistivity for ITO/silver interface is approximately 10-3 Ω cm 2, and often orders of magnitude higher for IO:H/silver interface of around several Ω cm 2, which is also the case for other less conductive metals, such as copper and aluminum [79]. Therefore, bilayers of IO:H/ITO may be more attractive. In this chapter, we developed IO:H/ITO stacks using IO:H to replace part of conventional ITO single layer to benefit the short circuit current. The effect of post-deposition annealing on electrical property of IO:H/ITO films were investigated to achieve high mobility and low resistivity. Then ITO single layer and IO:H/ITO bilayers, as two different TCO recipes, were studied and compared in terms of the opto-electrical properties on glass samples and then the performance on hybrid solar cells. 55
64 4.2 Opto-electrical properties of IO:H/ITO stacks In this part, glass samples were prepared to investigate the opto-electrical properties of TCO films, and precursor cells were fabricated to monitor passivation quality step by step, especially the TCO sputtering and the recovery after post-deposition annealing. Finally, two hybrid solar cells were fabricated to compare the performance with ITO single layer and IO:H/ITO bilayers. Figure 4.2 presents three sample structures respectively: (a) three different kinds of TCO layers on XG corning glass; (2) precursor sample with TCO/a-Si:H (n/i)/c-si/sio x/poly-si (p) structure; (3) finished solar cell with metal contacts based on precursor cell structure. To prepare the glass samples as illustrated in Figure 4.2 (a), cm 2 XG corning glass was used and following steps were performed: 1. Chemical cleaning: 10 min acetone and subsequent 10 min isopropanol (IPA) immersion in ultrasonic bath to remove any organic contaminants on corning glass, then using nitrogen gun to dry; 2. TCO sputtering: load the glass substrates into Zorro chamber, and the sputtering process consists of heating up, target cleaning, deposition and ramping down steps. The detailed sputtering parameters were shown in Table Post-deposition annealing: Low temperature post-deposition annealing in air ambient or vacuum environment was used to recover from induced sputtering damage and crystallize the films. For precursor and finished hybrid solar cells as demonstrated in Figure 4.2 (b) and (c), the fabrication steps were as follows: 1. Rear emitter formation: around 15 Å tunneling oxide was formed by wet-chemically cleaning and heavily-doped p-type poly-si was grown by LPCVD, ion-implantation and following high-temperature thermal annealing; 2. Texturing and FSF deposition: 5% TMAH solution was used to texture front surface and then 4.5 nm intrinsic and 6 nm n-type a-si:h were deposited by PECVD in Amor after 3 NAOC cleaning. To improve passivation quality, H 2 flow post-deposition annealing was performed in 180 C Amor chamber for 30 min. The detailed deposition conditions were shown in Table 3.1; 3. TCO sputtering and post-deposition annealing: 75 nm TCO was deposited on textured front surface by RF-sputtering in Zorro, and low-temperature post-deposition annealing was used; 4. Front and rear metal contacts: 6 μm Al was evaporated at front textured surface and 200 nm Ag 30 nm Cr 2 μm Al at planar rear side. 56
 glass sample with TCO layers; (b) a precursor cell with TCO/a-Si:H (n/i) layers on front textured surface and SiOx/poly-Si (p) films on rear flat surface; (c) a")
65 TCO (a) (b) (c) Figure 4.2: Schematic sample structures: (a) glass sample with TCO layers; (b) a precursor cell with TCO/a-Si:H (n/i) layers on front textured surface and SiOx/poly-Si (p) films on rear flat surface; (c) a complete hybrid solar cell. In order to reduce passivation degradation induced by ion bombardment during TCO sputtering, initial TCO sputtering power was chosen as low as possible after considering the plasma stability, which primarily only sacrifices the deposition rate. Therefore, 25 W initial sputtering power was chosen for IO:H deposition and 20 W initial power for ITO. 57
66 Table 4.1: Deposition conditions of 75 nm IO:H/ITO stacks on textured front surface 2 IO:H stacks ITO Thickness (nm) P deposition (mbar) P H2O, partial (mbar) T substrate ( C) P sputtering (W) Ar (sccm) Table 4.2: Deposition conditions of 75 nm ITO single layer on textured front surface 3 ITO layer Thickness (nm) P deposition (mbar) T substrate ( C) P sputtering (W) Ar (sccm) Table 4.3: Deposition conditions of 75 nm IO:H stacks on textured front surface IO:H Thickness (nm) 75 P deposition (mbar) P H2O, partial (mbar) T substrate ( C) 25 P sputtering (W) 135 Ar (sccm) 40 2 During IO:H/ITO stacks deposition, 25 W initial sputtering power was used for first 10 nm IO:H film to minimize sputtering damage, then the power jumped to 135 W for fast IO:H deposition of 55 nm. Finally, the samples were transferred to ITO chamber for last 10 nm ITO deposition at 200 W power. 3 During ITO deposition, initial sputtering power of 20 W was used for first 10 nm thickness to minimize sputtering damage, then jumped to 200 W for next 65 nm. 58
67 4.2.1 Effect of post-deposition annealing on IO:H/ITO samples To recover the TCO sputter-induced passivation degradation and crystallize IO:H film to improve the mobility and decrease the carrier density, post-deposition annealing after TCO sputtering is a mandatory step. Based on previous experiments, it was found that passivation quality deteriorates dramatically if IO:H/ITO stacks are annealed together after deposition. The lifetime declines from 4.86 ms to 3.46 ms and implied-v OC drops from 715 mv to 703 mv on symmetric TCO/a-Si:H (n/i)/c-si/ a-si:h (i/n)/tco structure samples before and after 190 C 30min post-deposition annealing in oven. Therefore, after IO:H deposition, the samples were transferred to vacuum environment for post-deposition annealing treatment to achieve crystallization of IO:H film. Afterwards, ITO film was sputtered onto the IO:H layer without any further post-deposition annealing to prevent passivation degradation when annealed together. The process flowchart of glass samples as depicted in Figure 4.2 (a) is shown in Figure 4.3. The relative layers thickness for IO:H/ITO stacks are based on the layers thickness on random textured silicon surface multiplying by a theoretical geometric factor of 1.73 [50], [84], which means the thicknesses for 20 W-sputtered IO:H film, 135 W-deposited IO:H layer and 200 W-sputtered ITO are 17 nm, 95 nm and 17 nm respectively on glass samples cm 2 corning glass 10 min acetone + 10 min IPA 112 nm IO:H sputtering Vacuum post-deposition annealing 17 nm ITO sputtering Figure 4.3: Flowchart of glass samples with 129 nm IO:H/ITO stacks. The ratio of the IO:H (20 W)/IO:H (135 W)/ITO (200 W) layers thickness is 1 : 5.5 : 1, the same ratio as on the textured surface. To optimize post-deposition annealing temperature on IO:H films, 129 nm IO:H bilayers were deposited on glass substrates first, then the samples were transferred to vacuum environment in Amor chamber for different temperature post-deposition annealing for 30 min, afterwards, the last 17 nm ITO films was deposited on top of IO:H films. The electrical properties of mobility, carrier density and resistivity were chosen as main indicators for more transparent (low carrier density) and highly conductive (low resistivity and high mobility) TCO films, as illustrated in Figure 4.4. The sample at 170 C post-deposition annealing presented lowest resistivity of Ω cm and sheet resistance of Ω/, which, however, mainly stem from highest carrier density of cm -3. As the annealing temperature rises after 170 C, the resistivity of IO:H/ITO stacks increases. 180 C annealed sample showed optimal performance with high 59
68 Resistivity (x 10-4 cm) mobility of cm 2 /(V s) and low carrier density of cm -3. Compared to the as-deposited samples without annealing, the mobility of annealed samples is almost doubled and carrier density declines to the half, which increase the resistivity of films slightly. The high mobility is mainly realized by solid-phase crystallization of amorphous IO:H films deposited at room temperature after the post-deposition annealing [30], [83] Mobility Carrier density Mobility (cm 2 / Vs) Carrier density (x / cm 3 ) Resistivity Sheet resistance Sheet resistance ( ) Annealing temperature ( o C) 35 Figure 4.4: Mobility, carrier density, resistivity and sheet resistance of 129 nm IO:H/ITO samples on corning glass as a function of post-deposition annealing temperature for IO:H films in vacuum. The reference values of as-deposited IO:H/ITO samples without post-deposition annealing were measured: μ = cm 2 /(V s), N = cm -3, ρ = Ω cm and Rsheet = 39.8 Ω/. 60
69 4.2.2 Comparison between ITO layer and IO:H/ITO stacks In order to deeply investigate how TCO influences the solar cells performance, the electrical properties and optical properties of three different TCO types: ITO, IO:H/ITO and IO:H were investigated. Three different TCO layers with 129 nm thickness were sputtered on glass substrates respectively with the deposition recipes shown in Table The 129 nm-thick ITO sample, which consists of 17 nm ITO film sputtered at 20 W power capped with 112 nm ITO deposited at 200 W power, was annealed at 190 C in air for 30 min. And for IO:H/ITO samples, 25 W sputtering power was used for first 17 nm IO:H and next 95 nm IO:H was deposited at 135 W high power. Then 30 min post-deposition annealing at 180 C in vacuum was used for IO:H films. Finally, last 17 nm ITO was sputtered at 200 W without any post-deposition annealing. The process for IO:H single layer was much easier that only 135 W high power was used to deposit 129 nm IO:H and then the sample was annealed at 180 C in vacuum for 30 min. The electrical properties of ITO, IO:H/ITO and IO:H were shown in Table 4.4. The mobility μ, carrier density N and resistivity ρ were measure by Hall effect, and sheet resistance R sheet was obtained from four-point probe. The contact resistivity ρ contact was measured by transmission line model (TLM) based on hybrid solar cell structure, which mainly comes from TCO/front metal (aluminum) interface. Since TCO layer is conductive enough so that the measurement current mostly flows from contact metal into TCO layer and then flows back to front metal. Table 4.4: Electrical properties of ITO, IO:H/ITO and IO:H μ N ρ R sheet ρ contact (cm 2 V -1 s -1 ) ( cm -3 ) ( 10-4 Ω cm) (Ω/ ) ( 10-2 Ω cm 2 ) ITO IO:H/ITO IO:H As-deposited Annealed As-deposited Annealed As-deposited Annealed The mobility in IO:H films is rather higher than ITO which is realized by H 2O vapor introduced during IO:H deposition. Water vapor during sputtering acts as a source of hydrogen donors, which improves intra- and inter-grain properties remarkably [30]. Besides, water vapor induces an amorphous structure rather than polycrystalline one, which can be transformed into crystalline after post-deposition annealing [30], [79]. Post-deposition annealing is of great importance to achieve low carrier density and high mobility for IO:H films due to the solid-phase crystallization of amorphous IO:H films deposited at room temperature [30]. The 61
70 Absorbance (-) highest mobility was presented in IO:H/ITO sample after post-deposition annealing together with lowest carrier density. Moreover, ITO presents the highest resistivity mainly due to the lowest mobility of approximately four times lower than IO:H films. An issue that might affect performance in terms of series resistance in the solar cells is that the contact resistance between either ITO or IO:H/ITO stacks and aluminum interface is one order magnitude higher than the reference values of around Ω cm 2 [79]. The optical properties of ITO, IO:H/ITO and IO:H are shown in Figure 4.5. The absorbance has been calculated by 1-R-T, where R and T are reflectance and transmittance respectively measured by spectrophotometer. The absorbance of IO:H film is lower than that of ITO over the complete spectral range, especially in the UV-visible region. The absorption is rather less in NIR region for all three samples and the absorbance difference between IO:H and ITO film is less pronounced in these wavelength, which is slightly different from the results reported in other groups [30], [79], [83]. This less absorbance in NIR region indicates high-quality ITO and IO:H films were developed Absorbance (-) ITO IO:H/ITO IO:H Wavelength (nm) Absorbance (-) Wavelength (nm) Wavelength (nm) Figure 4.5: Absorption spectra for ITO (annealed C in air), IO:H/ITO stacks (IO:H film annealed C in vacuum) and IO:H (annealed C in vacuum), calculated by 1-R-T. Insets are presented in the plot to highlight the short-wavelength and NIR part os the sprctrum. IO:H was used as a reference. 62

71 (a) eff (ms) ivoc (mv) TCO ivoc (mv) p-poly symmetric i/n deposition - H2 annealing ITO sputtering - as deposited Post-annealing 660 (b) eff (ms) p-poly symmetric i/n deposition - H2 annealing IO:H sputtering - as deposited IO:H post-annealing ITO sputtering 660 Figure 4.6: Lifetime at Δ=10 15 cm -3 and ivoc for different process steps during precursor cells fabrication: (a) cell #1 with ITO; (b) cell #2 with IO:H/ITO stacks. Measured in Sinton lifetime tester. Optical constant values were set as 0.7/0.8 for the structures without/with TCO respectively. 63
72 It is of significant importance for monitoring passivation quality for every-step process, as shown in Figure 4.6. Damage by TCO sputtering on a-si:h has been observed on both cell precursors with ITO and IO:H/ITO. Considerable passivation degradation was measured in precursor cell after ITO sputtering. High lifetime of 3.36 ms and iv OC of 698 mv was obtained for precursor cell after i/n deposition and H 2 flow annealing. While after ITO sputtering, a severe decline of 74% in lifetime and a drop of 27 mv in iv OC were observed. This passivation degradation can be mostly recovered by post-deposition annealing after ITO deposition. In literature, permanent microscopic changes have been observed in the a-si:h network involving Si-H bonds after TCO sputtering and subsequent annealing, which indicates passivation quality may not be directly affected by microstructure of a-si:h films [75]. This sputter-induced damage is merely pronounced after IO:H sputtering which may be partly due to the gentle room temperature sputtering or IO:H material itself. The post-deposition annealing after IO:H deposition can recover passivation quality and crystallize the IO:H film to reduce the carrier density and improve the mobility. The last 10 nm ITO deposited on textured IO:H layer improves the lifetime further to 4.14 ms, which is slightly higher than that after i/n a-si:h deposition annealed in H 2 flow. As the sample experienced an extra annealing at 110 C during the ITO deposition which improves passivation quality further. With proceeding the precursor cells further, 6 μm Al was evaporated on the front textured surface and 200 nm Ag 30 nm Cr 2 μm Al was used as rear metal contacts on two hybrid solar cells #1 and #2 aforementioned. The performance results were shown in Table 4.5 and 1-R/EQE spectra was presented in Figure 4.7. Devices Table 4.5: Results of hybrid solar cells with two different TCO V OC J SC R s R sh FF (mv) (ma/cm 2 ) (Ω cm 2 ) (Ω m 2 ) (%) ɳ (%) pff (%) Cell #1 with ITO Cell #2 with IO:H/ITO A subtle difference of V OC between the cell with ITO and cell with IO:H/ITO comes from the process after i/n a-si:h deposition as shown in Figure 4.6 (a) and (b). Passivation degradation was mostly recovered by post-deposition annealing after TCO sputtering for both cells. There is a slight improvement of J SC for the cell #2 since IO:H layer, as an alternative for 65 nm ITO, has less pronounced parasitic absorption in UV-visible spectra and free carrier absorption in NIR region, which is shown in Figure 4.7. The blue curve stands for the EQE spectra for the cell with 64
73 EQE, 1-R (-) IO:H/ITO and the green curve is for the cell with ITO. In short wavelength region, cell #2 collects better than #1 because of more transparent IO:H/ITO stacks. A negligible gap between the 1-R and EQE was presented in the range from 750 nm to 1000 nm at the cell with ITO yet both 1-R curves are overlapped at the most wavelength ranges. This means the recombination is quenched dramatically which may be achieved by good-quality texturing process (homogeneous pyramid size and shape) and passivation to eliminate the dangling bonds in the c-si surface. Moreover, a slightly higher FF was obtained at the cell with ITO due to the lower series resistance and higher shunt resistance. This decrease of series resistance in #1 is not from the TCO layer since ITO (in cell #1) has higher resistivity and higher contact resistivity at the ITO/aluminum interface compared to IO:H/ITO stacks (in cell #2), as shown in Table 4.4. Therefore, other experimental processes before the TCO sputtering or the difference of the c-si bulks may lead to the FF increase R ITO IO:H / ITO EQE ITO IO:H / ITO Wavelength (nm) Figure 4.7: 1-R and EQE spectra of hybrid solar cells with two different TCO layers: ITO single layer with lower JSC of ma/cm 2 ; IO:H/ITO stacks with slightly higher JSC of ma/cm 2. 65
74 4.3 Conclusion In this chapter, IO:H capped with top ITO stacks, as an attractive alternative to replace conventional ITO single layer, were developed to benefit the J SC while still maintain the FF. The post-deposition annealing temperature after IO:H deposition was first optimized in terms of the electrical properties. High mobility of cm 2 /(V s) and low carrier density of cm -3 on glass sample with IO:H/ITO stacks have been measured after 180 C annealing in vacuum for 30 min. Then, the opto-electrical properties of ITO, IO:H/ITO and IO:H films were compared. Either IO:H/ITO stacks or IO:H single layer shows nearly 4 times higher mobility after post-deposition annealing compared to ITO film, which is realized by H 2O vapor introduced during deposition and solid-phase crystallization after post-deposition annealing, thus leading to lower resistivity. After the annealing, the carrier density decreases to the half on IO:H/ITO stacks and IO:H layer compared to nearly doubled on ITO film which shows more optical absorption in the UV-visible region. The TCO sputtering ion bombardment induces damage to a-si network and causes passivation degradation, which is significantly severe after ITO deposition. A distinct decline of 74% in lifetime and 27 mv in iv OC has been observed after ITO deposition for the solar cell precursor with ITO layer. This passivation degradation is less pronounced after IO:H deposition which may be due to the gentle room temperature deposition. Post-deposition annealing can nearly fully recover passivation degradation for both samples. With proceeding the precursor cells further, two hybrid solar cells were fabricated with IO:H/ITO stacks and ITO single layer. Open circuit voltage is close between two solar cells (704 mv for cell #1 and 707 mv for cell #2). A slight improvement of J SC was obtained in the cell with IO:H/ITO stacks since IO:H layer, as an alternative for 65 nm ITO, has less pronounced parasitic absorption in UV-visible and NIR region. However, the cell with ITO shows excellent spectral response in the visible-nir range from 640 nm to 1030 nm where the recombination is of rare significance. This may be achieved by good-quality texturing process and passivation to eliminate the dangling bonds at c-si surface. Furthermore, a slightly higher FF was obtained at the cell with ITO due to the lower series resistance and higher shunt resistance which mainly comes from other process steps. Finally, the highest conversion efficiency of 20.5% was obtained with V OC of 704 mv, J SC of 39.5 ma/cm 2 and FF of 73.8% on the cell with ITO. 66
75 5 Conclusions and Outlook 5.1 Conclusions This project aimed at improving SHJ/poly-Si passivating contact hybrid solar cells performance by means of optimizing front surface field of i/n a-si:h stacks and front TCO layer, including passivation quality improvement of i/n a-si:h stacks, trade-off between J SC and V OC with different thickness of i a-si:h layer, comparison between IO:H/ITO stacks and ITO single layer in terms of opto-electrical properties and effect on hybrid solar cells performance. It was found that effective surface cleaning pretreatment is crucial for obtaining high passivation quality of i/n a-si:h layers prior to PECVD deposition. With increasing wet cleaning cycle of NAOC, the effective lifetime τ eff improves significantly from 2.1 ms for 1 NAOC to 12.6 ms for 3 NAOC. To avoid cross-contamination deteriorating surface passivation, plasma cleaning of chamber and plasma deposition on substrate holder were developed that a decrease of saturation current density J 0 of 10.9 fa/cm 2 was obtained. The passivation quality of i/n a-si:h stacks benefits from post-deposition annealing. Optimal post-deposition annealing condition of 190 C 30 min in ambient air has been developed. Annealing at high temperature of 230 C is not recommended, since lifetime measurement shows that pronounced passivation degradation of 3.6 ms drop was observed after 48 h idle treatment. While low annealing temperature of 150 C suppresses passivation potential, leading to lower lifetime. Compared to air annealing, H 2 environment post-deposition annealing shows more appealing passivation performance which improves lifetime to 4.7 ms and decreases J 0 to
76 28.7 fa/cm 2 on solar cell precursors. The influence of front intrinsic a-si:h passivating layer thickness has been investigated. Effective lifetime and iv OC measured on symmetric structures are strictly related to i a-si:h thickness since thicker intrinsic layer provides excellent chemical passivation and reduces more defect density. Meanwhile, as non-absorber layer, thicker i a-si:h leads to more parasitic absorption loss, especially within 700 nm wavelength due to its approximately bandgap of 1.7 ev. There is a trade-off between V OC and J SC regarding i a-si:h layer thickness. Furthermore, intrinsic layer affects the carrier transport thus FF. Hybrid solar cell with 4.5 nm i layer presents highest FF of 73.0%, while thicker i layer of 7 nm prohibits the majority carrier electrons from tunneling and hopping into n-type layer which leads to lower FF of 68.8%. Moreover, slightly lower FF of 71.5% was obtained on hybrid solar cell with 3.5 nm i layer, which may be caused by: (i) serious defect-rich SiH 2 layer is formed due to the unstable plasma at the initial deposition, which is even worse when intrinsic a-si:h layer is thin; (ii) not effective passivation and high surface defect density lead to more recombination centers which inhibit the effective carrier transport. IO:H/ITO stacks, as an attractive alternative to replace conventional single ITO layer, have been developed to quench parasitic absorption of TCO layer thus improving J SC. Hall effect measurement on glass samples has shown that post-deposition annealing in vacuum is an effective method to decrease carrier density and increase mobility of IO:H/ITO stacks. 180 C annealed sample showed optimal performance with high mobility of 117 cm 2 /(V s) and low carrier density of cm -3. The opto-electrical properties of IO:H/ITO stacks, ITO single layer and IO:H single layer were compared on glass sample. Either IO:H/ITO stacks or IO:H single layer shows nearly 4 times higher mobility and half carrier density after post-deposition annealing compared to ITO single film, which lead to much lower resistivity of IO:H-related films. Absorption spectra illustrate that the optical absorption of IO:H/ITO stacks is lower than that of ITO film over the complete spectral range, especially in the UV-visible region. In terms of the passivation quality, TCO sputtering ion bombardment induces damage to a-si network and causes passivation degradation, which is significantly severe for ITO deposition. A distinct decline of 74% in lifetime and 27 mv in iv OC were observed after ITO deposition. This passivation degradation is less pronounced for IO:H deposition which may be due to the gentle room temperature deposition. However, post-deposition annealing can nearly fully recover passivation degradation for both sputtering. Two hybrid solar cells were fabricated with IO:H/ITO stacks and ITO single layer. Open circuit 68
77 voltage is close between two solar cells after the post-deposition annealing treatment. A slight improvement of J SC was measured in the cell with IO:H/ITO stacks which is due to the less parasitic absorption in UV-visible region for IO:H layer. While in the visible range, the cell with ITO has higher EQE due to less recombination. Moreover, owing to low series resistance and high shunt resistance, the cell with ITO layer shows a slightly higher FF. This increment of FF is not caused by TCO layer since ITO single layer has higher electrical resistivity as well as higher contact resistivity at the TCO/aluminum interface. The highest conversion efficiency of 20.5% was achieved on 9 cm 2 hybrid solar cell with V OC of 704 mv, J SC of 39.5 ma/cm 2 and FF of 73.8%. 5.2 Outlook Yoshikawa et al [33] calculated the theoretical efficiency limit for a single-junction c-si solar cell in 2017 considering recombination, optical and resistance losses in a real solar cell. The theoretical limit of 29.1% is calculated based on a c-si wafer with the thickness of 165 μm and resistivity of 3 Ω cm 2 (V OC = 752 mv, J SC = 43.7 ma/cm 2 and FF = 88.5%). Compared SHJ/poly-Si passivating contact hybrid solar cell with the optimal cell, the losses of 16.6% in FF, 11.7% in J SC and 6.4% in V OC are observed respectively. To quench these losses, following feasible improvements can be used Fill factor boost (1) Screen-printing and copper electroplating metallization techniques Front and rear metal contacts are of great significance for solar cell performance since they contribute to the series resistance and cause the front metal shading. Typically, high conductivity and high height-to-width aspect ratio are two rules for front metal design. The highest FF of 73.8% was obtained from evaporation on hybrid solar cells, which is limited by the thickness and conductivity of front aluminum. Silver-paste screen-printing and copper electroplating techniques are two promising alternatives for replacing aluminum evaporation to decrease the metal resistance due to high conductivity of Ag and Cu and thicker metal fingers (> 20 μm) [27], [32]. High FF of more than 80% can be obtained after optimization. Besides, Papakonstantinou [85] has successfully applied screen-printing technology to SHJ solar cell fabrication in our group before, which improve FF to 78.8% compared to 73.6% obtained from evaporation. 69
78 (2) Replacing ITO layer with low work function AZO film The work function of TCO (W TCO) layer plays a crucial role on the solar cell performance since it influences the carrier transport at the TCO/FSF interface and the total built-in potential of the device [77], [78]. To form a low Schottky barrier contact or even ohmic contact for TCO/a-Si:H (n) contact, the optimal W TCO should be less than 4.5 ev according to our simulation. With the decrease of W TCO, Schottky barrier decreases and the electrons transport much easier, eventually resulting in higher FF. Since the work function of ITO is slightly higher which varies from 4.3 ev to 5.1 ev from the literature [86], [87], a lower work function TCO layer is preferred. It was reported that aluminum-doped zinc oxide (AZO) has lower work function in the range of ev [88] [90], which is more promising for replacing ITO layer. However, the disadvantage of AZO film is low carrier mobility of 15 cm 2 /(V s) and high carrier concentration of cm -3, which result in high parasitic absorption, thus low J SC [91]. Figure 5.1: Schematic band diagram of c-si (n)/a-si:h (i/n)/tco structure with WTCO lower than n-type a-si:h Current increase (1) Decrease external reflection: double-layer ARC or black silicon Reflectance measurement shows there is considerable external reflection of average reflectance of 8.19% on hybrid solar cells, which limits J SC to a higher level. Further optimization should be carried out to decrease external reflection. During this thesis, double-layer antireflection coating design has been tested. According to the simulation from PV Lighthouse, 40 nm ITO capped with 90 nm SiO 2 design was chosen based on the refractive index analysis and reflection 70
79 simulation. Then double-layer ARC and conventional single ARC of 55 nm IO:H capped with 10 nm ITO were deposited on front surface of textured wafers. The results show double-layer ARC can decrease the average reflectance to 5.4% compared to 7.1% on IO:H/ITO single-layer ARC design. Moreover, thinner TCO layer (40 nm ITO) is used on double-layer ARC design which decreases the parasitic absorption of TCO thus higher J SC Single ARC - IO:H/ITO Double ARC - ITO/SiO 2 Reflectance (-) Wavelength (nm) Figure 5.2: The measured reflectance spectra on textured wafers with single-layer ARC (65 nm IO:H/10 nm ITO) and double-layer ARC (40 nm ITO/90 nm SiO2). Besides, black silicon project is under investigation in our group, which is a promising approach to eliminate front surface reflection, especially in the visible wavelength [92]. (2) Decrease parasitic absorption The disadvantage of applying a-si:h layers at the front side and poly-si at the rear side is that they cause parasitic absorption in short wavelength and long wavelength respectively. The further optimization can be using other wide bandgap materials to replace a-si:h, such as a-sic:h [73], or less absorbance coefficient materials in long wavelength to substitute poly-si, such as poly-sio X [39]. 71
80 5.2.3 Passivation improvement (1) Hydrogen plasma treatment for intrinsic a-si:h Compared to the excellent V OC of 750 mv on HIT solar cell [31], there is great space for improvement. One possibility is applying hydrogen plasma treatment (HPT) after intrinsic a-si:h layer deposition to reduce defect density and passivate dangling bonds further [93], [94]. While the problems may be induced by HPT are: (1) high concentration of hydrogen induces serious etching to a-si:h layer which may damage the c-si surface [95]; (2) high hydrogen dilution encourages the epitaxial growth of a-si:h film, which has a detrimental effect on passivation quality and is should be avoided [96]. (2) Hydrogenation treatment for rear poly-si Since post-deposition annealing for rear poly-si is carried out in N 2/O 2 atmosphere, other feasible annealing conditions can be tried. Remote plasma hydrogen passivation (RPHP) treatment is a promising method to improve the passivation quality of poly-si [37]. Besides, forming gas (N 2 and H 2 atmosphere) annealing (FGA) can be another alternative for providing hydrogen to passivate more dangling bonds at the interface which is tried out in our group before. 72
81 Acknowledgements Ten months ago, with the passion for solar energy, I chose the thesis topic related to solar cells fabrication, which was conducted in a professional group Photovoltaic Materials and Devices (PVMD). Ten month later, I was proud and satisfied about my choice and what I have done during this meaningful period. Concurrently, I would like to express my sincere appreciation to the people who has helped me on the thesis and in the life, full of gratitude. First, I would like to thank my supervisors, Olindo, Gianluca and Guangtao for their valuable advices, supports and long-time discussion to inspire me for deep dig in experiments and help me understand the scientific theory. Besides, I would like to express my gratitude to PVMD group members for teaching me to use lab equipments and improving presentation skills, especially Paul for band diagram understanding. Additionally, I would like to thank PVMD and EKL technicians, Martijn, Stefaan, Robert and Mario for training me how to use equipments correctly and safely and shooting the problems. Furthermore, I would like to thank my roommates and classmates in SET to help me in the life. And Finally, I would like to express my gratitude to my family for their unconditional love and support, from the bottom of my heart. Last but not least, as the strong voice send from Saudi oil minister three decades ago: The Stone Age didn t end for lack of stone, and the oil age will end long before the world runs out of oil., this would inspire all the engineers from Sustainable Energy Technology Program to strive for a more sustainable future, for us, for everyone. Hao Ge TU Delft library, July 2017
82
83 Bibliography [1] World Population Prospects - Population Division [2] Carrington and Damien, World population to hit 11bn in 2100 with 70% chance of continuous rise [3] U. E. I. Administartion, INTERNATIONAL ENERGY OUTLOOK [4] W. W. Simon Philipps, Photovoltaics Report, Fraunhofer ISE, [5] A. H. M. Smets, K. Jäger, O. Isabella, R. A. van Swaaij, and M. Zeman, Solar Energy: The physics and engineering of photovoltaic conversion, technologies and systems. UIT Cambridge Limited, [6] C. Polytechnique and R. D. E. Lausanne, Passivating contacts for homojunction solar cells using a-si:h / c-si hetero-interfaces, vol. 6392, [7] S. M. de de Nicolas, a-si : H/c-Si heterojunction solar cells : back side assessment and improvement, [8] D. A. Neamen, Semiconductor phystics and devices: basic principles, 4th editio. University of New Mexico, [9] W. Shockley and W. T. Read, Statistics of the Recombination of Holes and Electrons, Phys. Rev., vol. 87, no. 46, pp , [10] A. G. Aberle, Surface Passivation of Crystalline Silicon Solar Cells] A Review, pp , [11] A. Rohatgi, P. Doshi, J. Moschner, T. Lauinger, A. G. Aberle, and D. S. Ruby, Comprehensive study of rapid, low-cost silicon surface passivation technologies, IEEE Trans. Electron Devices, vol. 47, no. 5, pp , [12] E. Simoen, C. Gong, N. E. Posthuma, E. Van Kerschaver, J. Poortmans, and R. Mertens, A DLTS Study of SiO2 and SiO2/SiNx Surface Passivation of Silicon, J. Electrochem. Soc., vol. 158, no. 6, p. H612, [13] G. Dingemans et al., Stability of Al2O3 and Al2O3/a-SiNx:H stacks for surface passivation of crystalline silicon, J. Appl. Phys., vol. 106, no. 11, p , [14] M. Tucci, L. Serenelli, S. De Iuliis, and M. Izzi, Characterization of SiNx/a-Si:H crystalline silicon surface passivation under UV light exposure, Thin Solid Films, vol. 515, no. 19 SPEC. ISS., pp , [15] S. W. Glunz, D. Biro, S. Rein, and W. Warta, Field-effect passivation of the SiO2Si interface, J. Appl. Phys., vol. 86, no. 1, pp , [16] E. H. Nicollian and J. R. Brews, MOS (metal oxide semiconductor) physics and technology TT -. New York : Wiley,. [17] M. Kerr and A. Cuevas, Very low bulk and surface recombination in oxidized silicon wafers, Inst. Phys. Publ., vol. 35, [18] S. Xiao and S. Xu, High-Efficiency Silicon Solar Cells Materials and Devices Physics, Crit. Rev. Solid State Mater. Sci., vol. 39, no. 4, pp , [19] T. Lauinger, J. Schmidt, A. G. Aberle, and R. Hezel, Record low surface recombination velocities on 1 cm p-silicon using remote plasma silicon nitride passivation, Appl. Phys. Lett., vol. 68, no. 9,
84 pp , [20] M. J. Kerr, J. Schmidt, A. Cuevas, and J. H. Bultman, Surface recombination velocity of phosphorus-diffused silicon solar cell emitters passivated with plasma enhanced chemical vapor deposited silicon nitride and thermal silicon oxide, J. Appl. Phys., vol. 89, no. 7, pp , [21] S. Xiao and S. Xu, High-Efficiency Silicon Solar Cells Materials and Devices Physics, vol. 8436, no. May, [22] F. Werner et al., Very low surface recombination velocities on p - and n -type c-si by ultrafast spatial atomic layer deposition of aluminum oxide, Appl. Phys. Lett., vol. 97, no. 16, pp. 3 6, [23] A. M. Albadri, Characterization of Al2O3 surface passivation of silicon solar cells, Thin Solid Films, vol. 562, pp , [24] J.-W. A. Schüttauf, K. H. M. van der Werf, I. M. Kielen, W. G. J. H. M. van Sark, J. K. Rath, and R. E. I. Schropp, Excellent crystalline silicon surface passivation by amorphous silicon irrespective of the technique used for chemical vapor deposition, Appl. Phys. Lett., vol. 98, no. 15, p , [25] T. Sawada et al., High-efficiency a-si/c-si heterojunction solar cell, Proc IEEE 1st World Conf. Photovolt. Energy Convers. - WCPEC (A Jt. Conf. PVSC, PVSEC PSEC), vol. 2, pp , [26] M. Taguchi, A. Terakawa, E. Maruyama, and M. Tanaka, Obtaining a higher voc in HIT cells, Prog. Photovoltaics Res. Appl., vol. 13, no. 6, pp , [27] H. Kanno, H. Sakata, M. Taguchi, and E. Maruyama, the Approaches for High Efficiency Hit Tm Solar Cell, 26th Eur. Photovolt. Sol. Energy Conf. Exhib., pp , [28] R. Varache, A. Valla, N. Nguyen, and D. Muñoz, Front side recombination losses analysis in rear emitter silicon heterojunction solar cells, Energy Procedia, vol. 55, no. 0, pp , [29] Y. Tsunomura et al., Twenty-two percent efficiency HIT solar cell, Sol. Energy Mater. Sol. Cells, vol. 93, no. 6 7, pp , [30] T. Koida, H. Fujiwara, and M. Kondo, Reduction of optical loss in hydrogenated amorphous silicon/crystalline silicon heterojunction solar cells by high-mobility hydrogen-doped in 2O3 transparent conductive oxide, Appl. Phys. Express, vol. 1, no. 4, pp , [31] M. Taguchi et al., 24.7% Record efficiency HIT solar cell on thin silicon wafer, IEEE J. Photovoltaics, vol. 4, no. 1, pp , [32] K. Masuko et al., Achievement of More Than 25% Conversion Efficiency With Crystalline Silicon Heterojunction Solar Cell, Photovoltaics, IEEE J., vol. 4, no. 6, pp , [33] K. Yoshikawa et al., Silicon heterojunction solar cell with interdigitated back contacts for a photoconversion efficiency over 26%, Nat. Energy, vol. 2, p , Mar [34] A. Descoeudres, Z. C. Holman, L. Barraud, S. Morel, S. De Wolf, and C. Ballif, >21% Efficient Silicon Heterojunction Solar Cells on n- and p-type Wafers Compared, IEEE J. Photovoltaics, vol. 3, no. 1, pp , [35] L. Korte and M. Schmidt, Doping type and thickness dependence of band offsets at the amorphous/crystalline silicon heterojunction, J. Appl. Phys., vol. 109, no. 6, [36] Y. K. E. Yablonovitch, T. Gmitter, RM. Swanson, A 720 mv open circuit voltage SiOx-c Si-SiOx double heterostructure solar cell. pplied Physics Letters, p. 47(11), ,
85 [37] F. Feldmann, C. Reichel, R. M??ller, and M. Hermle, The application of poly-si/siox contacts as passivated top/rear contacts in Si solar cells, Sol. Energy Mater. Sol. Cells, vol. 159, pp , [38] S. W. Glunz et al., the Irresistible Charm of a Simple Current Flow Pattern 25 % With a Solar Cell Featuring a Full-Area Back Contact, Proc. 31st Eur. Photovolt. Sol. Energy Conf. Exibition, no. September, pp , [39] G. Yang, Y. Zhang, P. Procel, A. Weeber, O. Isabella, and M. Zeman, Poly-Si ( O x ) Passivating Contacts for High-Efficiency c-si IBC Solar Cells, vol. 1, pp. 1 3, [40] Y. Tao, V. Upadhyaya, Y. Y. Huang, C. W. Chen, K. Jones, and A. Rohatgi, Carrier selective tunnel oxide passivated contact enabling 21.4% efficient large-area N-type silicon solar cells, Conf. Rec. IEEE Photovolt. Spec. Conf., vol Novem, pp , [41] R. Peibst et al., Working principle of carrier selective poly-si/c-si junctions: Is tunnelling the whole story?, Sol. Energy Mater. Sol. Cells, vol. 158, pp , [42] S. De Wolf and M. Kondo, Boron-doped a-si:hc-si interface passivation: Degradation mechanism, Appl. Phys. Lett., vol. 91, no. 11, pp. 1 4, [43] J. W. A. Schüttauf, C. H. M. Van Der Werf, I. M. Kielen, W. G. J. H. M. Van Sark, J. K. Rath, and R. E. I. Schropp, Improving the performance of amorphous and crystalline silicon heterojunction solar cells by monitoring surface passivation, J. Non. Cryst. Solids, vol. 358, no. 17, pp , [44] Z. Xiao-Dan et al., Research on the boron contamination at the p/i interface of microcrystalline silicon solar cells deposited in a single PECVD chamber, Chinese Phys. B, vol. 18, no. 10, pp , [45] F. Feldmann, M. Bivour, C. Reichel, M. Hermle, and S. W. Glunz, Passivated rear contacts for high-efficiency n-type Si solar cells providing high interface passivation quality and excellent transport characteristics, Sol. Energy Mater. Sol. Cells, vol. 120, no. PART A, pp , [46] D. Yan, A. Cuevas, Y. Wan, and J. Bullock, Passivating contacts for silicon solar cells based on boron-diffused recrystallized amorphous silicon and thin dielectric interlayers, Sol. Energy Mater. Sol. Cells, vol. 152, pp , [47] D. Yan, A. Cuevas, J. Bullock, Y. Wan, and C. Samundsett, Phosphorus-diffused polysilicon contacts for solar cells, Sol. Energy Mater. Sol. Cells, vol. 142, pp , [48] G. R. Wolstenholme, N. Jorgensen, P. Ashburn, and G. R. Booker, An investigation of the thermal stability of the interfacial oxide in polycrystalline silicon emitter bipolar transistors by comparing device results with high-resolution electron microscopy observations, J. Appl. Phys., vol. 61, no. 1, pp , [49] and J. Y. Ju Minkyu, Nagarajan Balaji, Cheolmin Park, Huong Thi Thanh Nguyen, Jian Cui, Donghyun Oh, Minhan Jeon, Jiyoon Kang, Gyeongbae Shim, The effect of small pyramid texturing on the enhanced passivation and efficiency of single c-si solar cells [50] G. Zhai, C. P. Church, A. J. Breeze, D. Zhang, G. B. Alers, and S. a Carter, Current Losses at the Front of Silicon Heterojunction Solar Cells, Nanotechnology, vol. 23, no. 40, p , [51] H. Fujiwara and M. Kondo, Impact of epitaxial growth at the heterointerface of a-si: H c-si solar cells, Appl. Phys. Lett., vol. 90, no. 1, p , [52] W. G. J. H.. Van sark, F. Roca, and L. Korte, Physics and technology of amorphous-crystalline heteronstrutures sillicon solar cells
86 [53] S. Kim et al., Low defect interface study of intrinsic layer for c-si surface passivation in a-si:h/c-si heterojunction solar cells, Thin Solid Films, vol. 521, pp , [54] R. Müller, Ion Implantation for High-Efficiency Silicon Solar Cells. BoD Books on Demand, [55] PerkinElmer Inc., Applications and Use of Integrating Spheres With the LAMBDA 650 and 850 UV/Vis and LAMBDA 950 UV/Vis/NIR Spectrophotometers. [56] Y. Hayashi, D. Li, A. Ogura, and Y. Ohshita, Role of i-asi:h layers in a-si:h/c-si heterojunction solar cells, IEEE J. Photovoltaics, vol. 3, no. 4, pp , [57] A. Kanevce and W. K. Metzger, The role of amorphous silicon and tunneling in heterojunction with intrinsic thin layer (HIT) solar cells, J. Appl. Phys., vol. 105, no. 9, [58] M. Tucci, L. Serenelli, S. De Iuliis, M. Izzi, G. De Cesare, and D. Caputo, Back contact formation for p-type based a-si:h/c-si heterojunction solar cells, Phys. Status Solidi Curr. Top. Solid State Phys., vol. 8, no. 3, pp , [59] R. Lachaume et al., Influence of a-si:h/ito interface properties on performance of heterojunction solar cells, Energy Procedia, vol. 38, pp , [60] A. Descoeudres et al., Improved amorphous/crystalline silicon interface passivation by hydrogen plasma treatment, Appl. Phys. Lett., vol. 99, no. 12, pp , [61] A. Descoeudres et al., The silane depletion fraction as an indicator for the amorphous/crystalline silicon interface passivation quality, Appl. Phys. Lett., vol. 97, no. 18, pp. 5 7, [62] K. A. Reinhardt and W. Kern, Handbook of silicon wafer cleaning technology. William Andrew, [63] D. Deligiannis et al., Wet-chemical treatment for improved surface passivation of textured silicon heterojunction solar cells, Energy Procedia, vol. 55, pp , [64] M. Mikolášek et al., The influence of post-deposition annealing upon amorphous silicon/crystalline silicon heterojunction solar cells, Mater. Sci. Eng. B Solid-State Mater. Adv. Technol., vol. 189, pp. 1 6, [65] F. Wang et al., Improved amorphous/crystalline silicon interface passivation for heterojunction solar cells by low-temperature chemical vapor deposition and post-annealing treatment, Phys. Chem. Chem. Phys., vol. 16, no. 37, p , [66] H. Angermann and J. Rappich, Surface States and Recombination Loss on Wet-Chemically Passivated Si Studied by Surface Photovoltage (SPV) and Photoluminescence (PL), Solid State Phenom., vol. 134, pp , [67] S. De Wolf and M. Kondo, Nature of doped a-si:h/c-si interface recombination, J. Appl. Phys., vol. 105, no. 10, pp. 1 6, [68] Jan-Willem and A. Schüttauf, Amorphous and crystalline silicon based heterojunction solar cells.. [69] S. De Wolf, S. Olibet, and C. Ballif, Stretched-exponential a-si:hc-si interface recombination decay, Appl. Phys. Lett., vol. 93, no. 3, pp. 1 4, [70] D. Pysch et al., Stretched-exponential increase in the open-circuit voltage induced by thermal annealing of amorphous silicon-carbide heterojunction solar cells, Appl. Phys. Lett., vol. 94, no. 9, pp , [71] H. Fujiwara and M. Kondo, Effects of a-si:h layer thicknesses on the performance of a-si:h/c-si heterojunction solar cells, J. Appl. Phys., vol. 101, no. 5, [72] S. Alivizatos, Investigation of Textured c-si Wafers for Application in Silicon Heterojunction 78
87 Solar Cells, no. October, [73] D. Zhang, Surface passivation and optical design of silicon heterojunction solar cells [74] S. Calnan and A. N. Tiwari, High mobility transparent conducting oxides for thin film solar cells, Thin Solid Films, vol. 518, no. 7. pp , [75] C. B. Bénédicte Demaurex, Stefaan De Wolf, Antoine Descoeudres, Zachary Charles Holman, Damage at hydrogenated amorphous/crystalline silicon interfaces by indium tin oxide overlayer sputtering [76] R. E. I. S. Yinghuan Kuanga, Bart Maccoa, Bora Karasulua, Chaitanya K. Andea, Paula C.P. Bronsveldb, Marcel A. Verheijena, Yizhi Wua, Wilhelmus M.M. Kesselsa, Towards the implementation of atomic layer deposited In2O3H in silicon.pdf [77] E. Centurioni and D. Iencinella, Role of front contact work function on amorphous silicon/crystalline silicon heterojunction solar cell performance, IEEE Electron Device Letters, vol. 24, no. 3. pp , [78] W. J. W. L. Zhao, C. L. Zhou, H. L. Li, H. W. Diao, Role of the work function of transparent conductive oxide on the performance of amorphous crystalline silicon heterojunction solar cells studied by computer simulation.pdf [79] L. Barraud et al., Hydrogen-doped indium oxide/indium tin oxide bilayers for high-efficiency silicon heterojunction solar cells, Sol. Energy Mater. Sol. Cells, vol. 115, pp , [80] S.-C. K. Do-Geun Kim, Sunghun Lee, Gun-Hwan Lee, Effects of hydrogen gas on properties of tin-doped indium oxide films deposited by radio frequency magnetron sputtering method [81] R. Bel Hadj Tahar, T. Ban, Y. Ohya, and Y. Takahashi, Tin doped indium oxide thin films: Electrical properties, Journal of Applied Physics, vol. 83, no. 5. pp , [82] M. S. Farhan, E. Zalnezhad, A. R. Bushroa, and A. A. D. Sarhan, Electrical and optical properties of indium-tin oxide (ITO) films by ion-assisted deposition (IAD) at room temperature, Int. J. Precis. Eng. Manuf., vol. 14, no. 8, pp , [83] H. Scherg-Kurmes et al., High mobility In2O3:H as contact layer for a-si:h/c-si heterojunction and??c-si:h thin film solar cells, Thin Solid Films, vol. 594, pp , [84] S. De Wolf, A. Descoeudres, Z. C. Holman, and C. Ballif, High-efficiency Silicon Heterojunction Solar Cells: A Review, Green, vol. 2, no. 1, [85] G. Papakonstantinou, Investigation and Optimization of the Front Metal Contact of Silicon Heterojunction Solar Cells, no. July, [86] K. Sugiyama, H. Ishii, Y. Ouchi, and K. Seki, Dependence of indium tin oxide work function on surface cleaning method as studied by ultraviolet and x-ray photoemission spectroscopies, J. Appl. Phys., vol. 87, no. 1, pp , [87] J. S. Kim et al., Kelvin probe and ultraviolet photoemission measurements of indium tin oxide work function: a comparison, Synth. Met., vol. 111, pp , [88] H. Kim et al., Transparent conducting aluminum-doped zinc oxide thin films for organic light-emitting devices, Appl. Phys. Lett., vol. 76, no. 3, pp , [89] X. Jiang, F. L. Wong, M. K. Fung, and S. T. Lee, Aluminum-doped zinc oxide films as transparent conductive electrode for organic light-emitting devices, Appl. Phys. Lett., vol. 83, no. 9, pp , [90] Q. Feng et al., Effect of deposition condition and UV-ozone post-treatment on work function of 79
88 DC magnetron sputtered AZO thin films, J. Mater. Sci. Mater. Electron., vol. 23, no. 1, pp , [91] J. Jeurink, F. Wagner, S. Park, L. Kroely, and W. Wolke, MF-sputtered AZO for a-si SHJ Solar Cells, Energy Procedia, vol. 55, pp , [92] H. Savin et al., Black silicon solar cells with interdigitated back-contacts achieve 22.1% efficiency, Nat. Nanotechnol., vol. 10, no. 7, pp , [93] Y. Zhang et al., Significant Improvement of Passivation Performance by Two-Step Preparation of Amorphous Silicon Passivation Layers in Silicon Heterojunction Solar Cells, Chinese Phys. Lett., vol. 34, no. 3, p , [94] L. Zhang et al., Investigation of positive roles of hydrogen plasma treatment for interface passivation based on silicon heterojunction solar cells, J. Phys. D. Appl. Phys., vol. 49, no. 16, p , [95] J. Ramanujam and A. Verma, Photovoltaic properties of a-si: H films grown by plasma enhanced chemical vapor deposition: a review, Mater. Express, vol. 2, no. 3, pp , [96] J. Geissbühler et al., Amorphous/crystalline silicon interface defects induced by hydrogen plasma treatments, Appl. Phys. Lett., vol. 102, no. 23, p ,
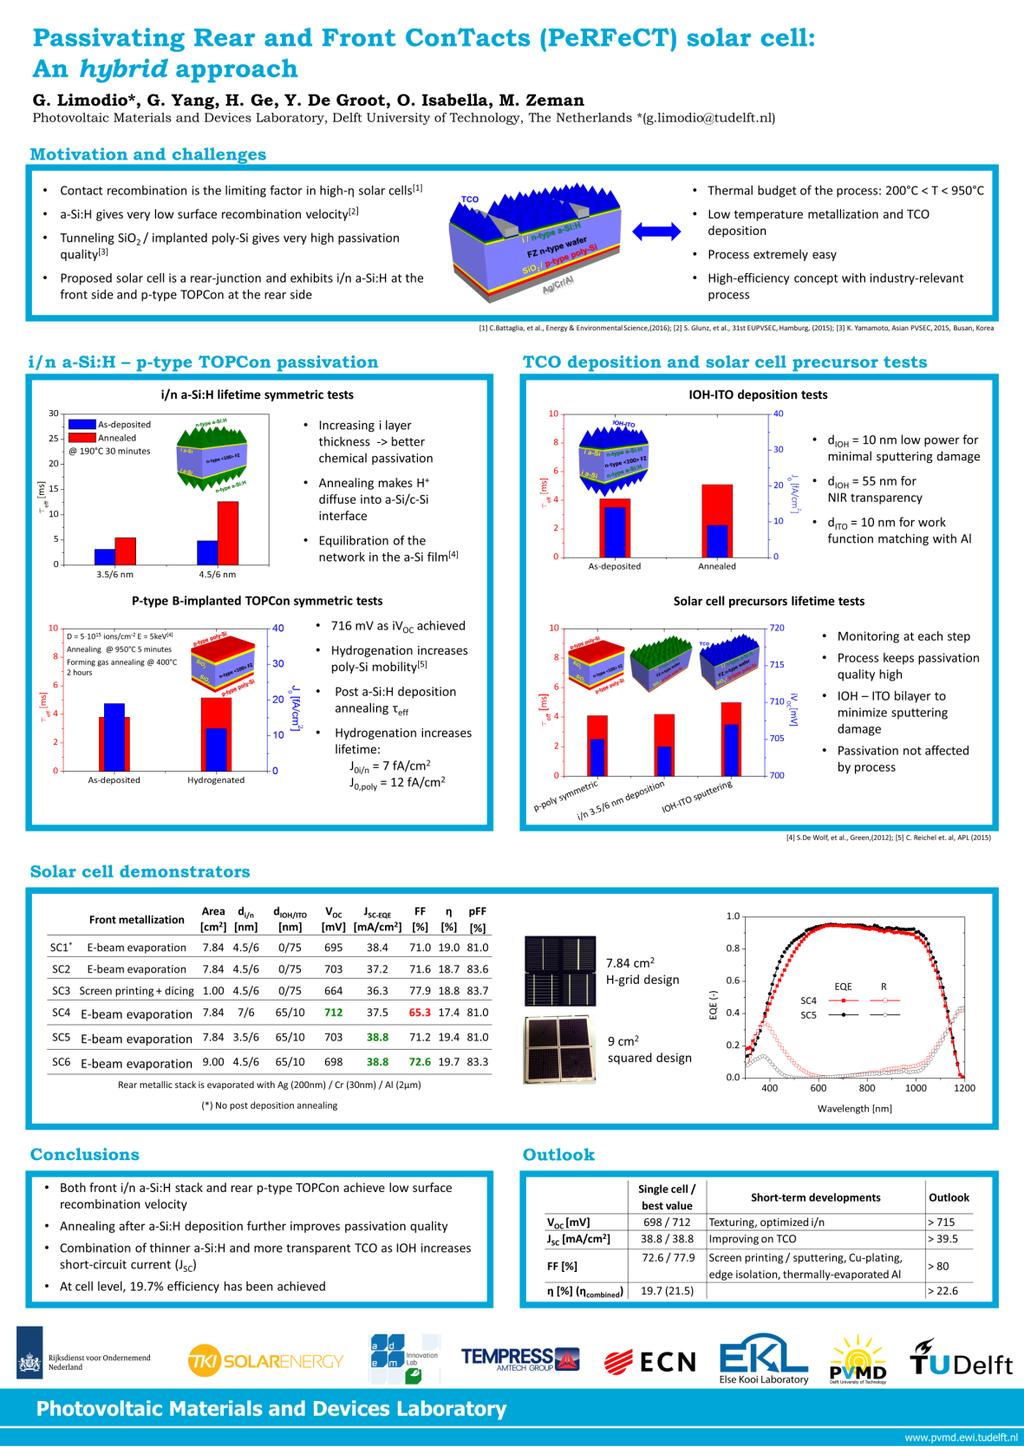
89 Appendix
REAR SURFACE PASSIVATION OF INTERDIGITATED BACK CONTACT SILICON HETEROJUNCTION SOLAR CELL AND 2D SIMULATION STUDY
 REAR SURFACE PASSIVATION OF INTERDIGITATED BACK CONTACT SILICON HETEROJUNCTION SOLAR CELL AND 2D SIMULATION STUDY Meijun Lu 1,2, Ujjwal Das 1, Stuart Bowden 1, and Robert Birkmire 1,2 1 Institute of Energy
Materials, Electronics and Renewable Energy
 Materials, Electronics and Renewable Energy Neil Greenham ncg11@cam.ac.uk Inorganic semiconductor solar cells Current-Voltage characteristic for photovoltaic semiconductor electrodes light Must specify
TWO-DIMENSIONAL MODELING OF EWT MULTICRYSTALLINE SILICON SOLAR CELLS AND COMPARISON WITH THE IBC SOLAR CELL
 TWO-DIMENSIONAL MODELING OF EWT MULTICRYSTALLINE SILICON SOLAR CELLS AND COMPARISON WITH THE IBC SOLAR CELL Mohamed M. Hilali, Peter Hacke, and James M. Gee Advent Solar, Inc. 8 Bradbury Drive S.E, Suite,
Amorphous Silicon Solar Cells
 The Birnie Group solar class and website were created with much-appreciated support from the NSF CRCD Program under grants 0203504 and 0509886. Continuing Support from the McLaren Endowment is also greatly
24th European Photovoltaic Solar Energy Conference and Exhibition, September 2009, Hamburg, Germany.
 STATUS OF N-TYPE SOLAR CELLS FOR LOW-COST INDUSTRIAL PRODUCTION Arthur Weeber*, Ronald Naber, Nicolas Guillevin, Paul Barton, Anna Carr, Desislava Saynova, Teun Burgers, Bart Geerligs ECN Solar Energy,
xsi PV Technologies: Status and Outlook of Passivated Contacts and Rear Contacted Solar Cells
 xsi PV Technologies: Status and Outlook of Passivated Contacts and Rear Contacted Solar Cells Thematic session 4 Bart Macco, Jimmy Melskens, Bas van de Loo, Lachlan Black, Willem-Jan Berghuis & Erwin Kessels
2. High Efficiency Crystalline Si Solar Cells
 2 High Efficiency Crystalline Si Solar Cells Students: Karthick Murukesan, Sandeep S S, Meenakshi Bhaisare, Bandana Singha, Kalaivani S and Ketan Warikoo Faculty members: Anil Kottantharayil, B M Arora,
INDUSTRIALLY FEASIBLE >19% EFFICIENCY IBC CELLS FOR PILOT LINE PROCESSING
 INDUSTRIALLY FEASIBLE >19% EFFICIENCY IBC CELLS FOR PILOT LINE PROCESSING F. J. Castaño 1, D. Morecroft 1, M. Cascant 1, H. Yuste 1, M.W.P.E. Lamers 2, A.A. Mewe 2, I.G. Romijn 2, E.E. Bende 2, Y. Komatsu
"Plasma CVD passivation; Key to high efficiency silicon solar cells",
 "Plasma CVD passivation; Key to high efficiency silicon solar cells", David Tanner Date: May 7, 2015 2012 GTAT Corporation. All rights reserved. Summary: Remarkable efficiency improvements of silicon solar
PV research in Neuchâtel: from high efficiency crystalline cells to novel module concepts
 PV research in Neuchâtel: from high efficiency crystalline cells to novel module concepts Laure-Emmanuelle Perret-Aebi, Christophe Ballif April 11 th 2014 Congrès Photovoltaïque National 2014, Lausanne
HF last passivation for high efficiency a-si:h/c-si heterojunction solar cells
 HF last passivation for high efficiency a-si:h/c-si heterojunction solar cells Adrien Danel, F. Souche, PJ. Ribeyron : INES Y. Le Tiec : LETI T. Nolan : Akrion Systems 1 A. Danel, UCPSS 20-1 Heterojonction
Semiconductor Technology
 Semiconductor Technology from A to Z Oxidation www.halbleiter.org Contents Contents List of Figures List of Tables II III 1 Oxidation 1 1.1 Overview..................................... 1 1.1.1 Application...............................
HIGH EFFICIENCY INDUSTRIAL SCREEN PRINTED N-TYPE SOLAR CELLS WITH FRONT BORON EMITTER
 HIGH EFFICIENCY INDUSTRIAL SCREEN PRINTED N-TYPE SOLAR CELLS WITH FRONT BORON EMITTER V.D. Mihailetchi 1, Y. Komatsu 1, G. Coletti 1, R. Kvande 2, L. Arnberg 2, C. Knopf 3, K. Wambach 3, L.J. Geerligs
Fabrication Technology
 Fabrication Technology By B.G.Balagangadhar Department of Electronics and Communication Ghousia College of Engineering, Ramanagaram 1 OUTLINE Introduction Why Silicon The purity of Silicon Czochralski
Review Article High-Efficiency Crystalline Silicon Solar Cells
 Advances in OptoElectronics Volume 2007, Article ID 97370, 15 pages doi:10.1155/2007/97370 Review Article High-Efficiency Crystalline Silicon Solar Cells S. W. Glunz Fraunhofer Institute for Solar Energy
Silver Diffusion Bonding and Layer Transfer of Lithium Niobate to Silicon
 Chapter 5 Silver Diffusion Bonding and Layer Transfer of Lithium Niobate to Silicon 5.1 Introduction In this chapter, we discuss a method of metallic bonding between two deposited silver layers. A diffusion
N-PERT BACK JUNCTION SOLAR CELLS: AN OPTION FOR THE NEXT INDUSTRIAL TECHNOLOGY GENERATION?
 N-PERT BACK JUNCTION SOLAR CELLS: AN OPTION FOR THE NEXT INDUSTRIAL TECHNOLOGY GENERATION? Bianca Lim *, Till Brendemühl, Miriam Berger, Anja Christ, Thorsten Dullweber Institute for Solar Energy Research
Figure 2.3 (cont., p. 60) (e) Block diagram of Pentium 4 processor with 42 million transistors (2000). [Courtesy Intel Corporation.
 (e) Block diagram of Pentium 4 processor with 42 million transistors (2000). [Courtesy Intel Corporation.") Figure 2.1 (p. 58) Basic fabrication steps in the silicon planar process: (a) oxide formation, (b) selective oxide removal, (c) deposition of dopant atoms on wafer, (d) diffusion of dopant atoms into exposed
Figure 2.1 (p. 58) Basic fabrication steps in the silicon planar process: (a) oxide formation, (b) selective oxide removal, (c) deposition of dopant atoms on wafer, (d) diffusion of dopant atoms into exposed
Thin film silicon technology. Cosimo Gerardi 3SUN R&D Tech. Coordinator
 Thin film silicon technology Cosimo Gerardi 3SUN R&D Tech. Coordinator 1 Outline Why thin film Si? Advantages of Si thin film Si thin film vs. other thin film Hydrogenated amorphous silicon Energy gap
Crystalline Silicon Solar Cells Future Directions. Stuart Bowden BAPVC January Stuart Bowden BAPVC January 12,
 Crystalline Silicon Solar Cells Future Directions Stuart Bowden BAPVC January 2011 Stuart Bowden BAPVC January 12, 2011 1 Stuart Bowden Co-Director of Solar Power Labs at ASU Work relevant to BAPVC: Pilot
Inductive Coupled Plasma (ICP) Textures as Alternative for Wet Chemical Etching in Solar Cell Fabrication
 Textures as Alternative for Wet Chemical Etching in Solar Cell Fabrication") Inductive Coupled Plasma (ICP) Textures as Alternative for Wet Chemical Etching in Solar Cell Fabrication 1 Motivation 2 Experimental setup 3 ICP textures as alternative technique 3.1 Surface morphology
Inductive Coupled Plasma (ICP) Textures as Alternative for Wet Chemical Etching in Solar Cell Fabrication 1 Motivation 2 Experimental setup 3 ICP textures as alternative technique 3.1 Surface morphology
EE40 Lec 22. IC Fabrication Technology. Prof. Nathan Cheung 11/19/2009
 Suggested Reading EE40 Lec 22 IC Fabrication Technology Prof. Nathan Cheung 11/19/2009 300mm Fab Tour http://www-03.ibm.com/technology/manufacturing/technology_tour_300mm_foundry.html Overview of IC Technology
Chapter 3 Silicon Device Fabrication Technology
 Chapter 3 Silicon Device Fabrication Technology Over 10 15 transistors (or 100,000 for every person in the world) are manufactured every year. VLSI (Very Large Scale Integration) ULSI (Ultra Large Scale
METALLIZATION OF PASSIVATING AND CARRIER SELECTIVE CONTACTS: STATUS AND PERSPECTIVES AT FRAUNHOFER ISE
 METALLIZATION OF PASSIVATING AND CARRIER SELECTIVE CONTACTS: STATUS AND PERSPECTIVES AT FRAUNHOFER ISE M. Bivour, J. Bartsch, F. Clement, G. Cimiotti, D. Erath, F. Feldmann, T. Fellmeth, M. Glatthaar,
Ion Implantation Most modern devices doped using ion implanters Ionize gas sources (single +, 2+ or 3+ ionization) Accelerate dopant ions to very
 Accelerate dopant ions to very") Ion Implantation Most modern devices doped using ion implanters Ionize gas sources (single +, 2+ or 3+ ionization) Accelerate dopant ions to very high voltages (10-600 KeV) Use analyzer to selection charge/mass
Ion Implantation Most modern devices doped using ion implanters Ionize gas sources (single +, 2+ or 3+ ionization) Accelerate dopant ions to very high voltages (10-600 KeV) Use analyzer to selection charge/mass
Ultra High Barrier Coatings by PECVD
 Society of Vacuum Coaters 2014 Technical Conference Presentation Ultra High Barrier Coatings by PECVD John Madocks & Phong Ngo, General Plasma Inc., 546 E. 25 th Street, Tucson, Arizona, USA Abstract Silicon
Presented at the 29th European PV Solar Energy Conference and Exhibition, September 2014, Amsterdam (NL)
") POCL3-BASED CO-DIFFUSION PROCESS FOR N-TYPE BACK-CONTACT BACK-JUNCTION SOLAR CELLS R. Keding 1,2, M. Hendrichs 1, D.Stüwe 1, M. Jahn 1, C. Reichel 1, D. Borchert 1, A.Wolf 1, H. Reinecke 3, D.Biro 1 1
POCL3-BASED CO-DIFFUSION PROCESS FOR N-TYPE BACK-CONTACT BACK-JUNCTION SOLAR CELLS R. Keding 1,2, M. Hendrichs 1, D.Stüwe 1, M. Jahn 1, C. Reichel 1, D. Borchert 1, A.Wolf 1, H. Reinecke 3, D.Biro 1 1
Anodic Aluminium Oxide for Passivation in Silicon Solar Cells
 Anodic Aluminium Oxide for Passivation in Silicon Solar Cells School of Photovoltaic & Renewable Energy Engineering Zhong Lu Supervisor: Alison Lennon May. 2015 Co-supervisor: Stuart Wenham Outline Introduction
Passivating contacts for crystalline silicon solar cells
 Passivating contacts for crystalline silicon solar cells Melskens, J.; van de Loo, B.W.H.; Macco, B.; Black, L.E.; Smit, S.; Kessels, W.M.M. Published in: IEEE Journal of Photovoltaics DOI: 10.1109/JPHOTOV.2018.2797106
Simulation of High Efficiency Heterojunction Solar Cells with AFORS-HET
 Journal of Physics: Conference Series Simulation of High Efficiency Heterojunction Solar Cells with AFORS-HET To cite this article: Wang Lisheng et al 2011 J. Phys.: Conf. Ser. 276 012177 View the article
Surface Preparation Challenges in Crystalline Silicon Photovoltaic Manufacturing
 Surface Preparation Challenges in Crystalline Silicon Photovoltaic Manufacturing Kristopher Davis 1,3, Andrew C. Rudack 2,3, Winston Schoenfeld 1,3 Hubert Seigneur 1,3, Joe Walters 1,3, Linda Wilson 2,3
Available online at ScienceDirect. Energy Procedia 92 (2016 ) Mathieu Boccard*, Nathan Rodkey, Zachary C.
 Mathieu Boccard*, Nathan Rodkey, Zachary C.") Available online at www.sciencedirect.com ScienceDirect Energy Procedia 92 (2016 ) 297 303 6th International Conference on Silicon Photovoltaics, SiliconPV 2016 High-mobility hydrogenated indium oxide
Available online at www.sciencedirect.com ScienceDirect Energy Procedia 92 (2016 ) 297 303 6th International Conference on Silicon Photovoltaics, SiliconPV 2016 High-mobility hydrogenated indium oxide
HOMEWORK 4 and 5. March 15, Homework is due on Monday March 30, 2009 in Class. Answer the following questions from the Course Textbook:
 HOMEWORK 4 and 5 March 15, 2009 Homework is due on Monday March 30, 2009 in Class. Chapter 7 Answer the following questions from the Course Textbook: 7.2, 7.3, 7.4, 7.5, 7.6*, 7.7, 7.9*, 7.10*, 7.16, 7.17*,
Available online at ScienceDirect. Energy Procedia 55 (2014 )
") Available online at www.sciencedirect.com ScienceDirect Energy Procedia 55 (2014 ) 287 294 4th International Conference on Silicon Photovoltaics, SiliconPV 2014 Codiffused bifacial n-type solar cells (CoBiN)
Available online at www.sciencedirect.com ScienceDirect Energy Procedia 55 (2014 ) 287 294 4th International Conference on Silicon Photovoltaics, SiliconPV 2014 Codiffused bifacial n-type solar cells (CoBiN)
High Transmittance Ti doped ITO Transparent Conducting Layer Applying to UV-LED. Y. H. Lin and C. Y. Liu
 High Transmittance Ti doped ITO Transparent Conducting Layer Applying to UV-LED Y. H. Lin and C. Y. Liu Department of Chemical Engineering and Materials Engineering, National Central University, Jhongli,
R&D ACTIVITIES AT ASSCP-BHEL,GURGAON IN SOLAR PV. DST-EPSRC Workshop on Solar Energy Research
 R&D ACTIVITIES AT -BHEL,GURGAON IN SOLAR PV at the DST-EPSRC Workshop on Solar Energy Research (22 nd 23 rd April, 2009) by Dr.R.K. Bhogra, Addl. General Manager & Head Email: cpdrkb@bhel.co.in Dr.A.K.
Schottky-barrier and MIS solar cells
 Schottky-barrier and MIS solar cells (Metal-Insulator- Semiconductor) Steve Byrnes NSE 290 Final Presentation December 1, 2008 Outline Background on Schottky barriers Dark and light I-V curves, and effect
Process Flow in Cross Sections
 Process Flow in Cross Sections Process (simplified) 0. Clean wafer in nasty acids (HF, HNO 3, H 2 SO 4,...) --> wear gloves! 1. Grow 500 nm of SiO 2 (by putting the wafer in a furnace with O 2 2. Coat
OPTICAL, ELECTRICAL AND STRUCTURAL PROPERTIES OF PECVD QUASI EPITAXIAL PHOSPHOROUS DOPED SILICON FILMS ON CRYSTALLINE SILICON SUBSTRATE
 OPTICAL, ELECTRICAL AN STRUCTURAL PROPERTIES OF PECV QUASI EPITAXIAL PHOSPHOROUS OPE SILICON FILMS ON CRYSTALLINE SILICON SUBSTRATE Mahdi Farrokh-Baroughi, Hassan El-Gohary, and Siva Sivoththaman epartment
Available online at ScienceDirect. Energy Procedia 84 (2015 ) 17 24
 17 24") Available online at www.sciencedirect.com ScienceDirect Energy Procedia 84 (2015 ) 17 24 E-MRS Spring Meeting 2015 Symposium C - Advanced inorganic materials and structures for photovoltaics Annealing
Available online at www.sciencedirect.com ScienceDirect Energy Procedia 84 (2015 ) 17 24 E-MRS Spring Meeting 2015 Symposium C - Advanced inorganic materials and structures for photovoltaics Annealing
VLSI INTRODUCTION P.VIDYA SAGAR ( ASSOCIATE PROFESSOR) Department of Electronics and Communication Engineering, VBIT
 Department of Electronics and Communication Engineering, VBIT") VLSI INTRODUCTION P.VIDYA SAGAR ( ASSOCIATE PROFESSOR) contents UNIT I INTRODUCTION: Introduction to IC Technology MOS, PMOS, NMOS, CMOS & BiCMOS technologies. BASIC ELECTRICAL PROPERTIES : Basic Electrical
VLSI INTRODUCTION P.VIDYA SAGAR ( ASSOCIATE PROFESSOR) contents UNIT I INTRODUCTION: Introduction to IC Technology MOS, PMOS, NMOS, CMOS & BiCMOS technologies. BASIC ELECTRICAL PROPERTIES : Basic Electrical
Solar Spectrum. -Black body radiation. Light bulb 3000 K Red->Yellow->White Surface of Sun 6000 K
 Solar Spectrum 1 Solar Spectrum -Black body radiation Light bulb 3000 K Red->Yellow->White Surface of Sun 6000 K 2 Solar Spectrum -Black body radiation Light bulb 3000 K Red->Yellow->White Surface of Sun
Lecture Day 2 Deposition
 Deposition Lecture Day 2 Deposition PVD - Physical Vapor Deposition E-beam Evaporation Thermal Evaporation (wire feed vs boat) Sputtering CVD - Chemical Vapor Deposition PECVD LPCVD MVD ALD MBE Plating
Schottky Tunnel Contacts for Efficient Coupling of Photovoltaics and Catalysts
 Schottky Tunnel Contacts for Efficient Coupling of Photovoltaics and Catalysts Christopher E. D. Chidsey Department of Chemistry Stanford University Collaborators: Paul C. McIntyre, Y.W. Chen, J.D. Prange,
EECS130 Integrated Circuit Devices
 EECS130 Integrated Circuit Devices Professor Ali Javey 9/13/2007 Fabrication Technology Lecture 1 Silicon Device Fabrication Technology Over 10 15 transistors (or 100,000 for every person in the world)
1. Introduction. What is implantation? Advantages
 Ion implantation Contents 1. Introduction 2. Ion range 3. implantation profiles 4. ion channeling 5. ion implantation-induced damage 6. annealing behavior of the damage 7. process consideration 8. comparison
Materials Characterization
 Materials Characterization C. R. Abernathy, B. Gila, K. Jones Cathodoluminescence (CL) system FEI Nova NanoSEM (FEG source) with: EDAX Apollo silicon drift detector (TE cooled) Gatan MonoCL3+ FEI SEM arrived
Radiation Tolerant Isolation Technology
 Radiation Tolerant Isolation Technology Background The following contains a brief description of isolation technologies used for radiation hardened integrated circuits. The technologies mentioned are junction
Lecture 4. Oxidation (applies to Si and SiC only) Reading: Chapter 4
 Reading: Chapter 4") Lecture 4 Oxidation (applies to Si and SiC only) Reading: Chapter 4 Introduction discussion: Oxidation: Si (and SiC) Only The ability to grow a high quality thermal oxide has propelled Si into the forefront
Lecture 4 Oxidation (applies to Si and SiC only) Reading: Chapter 4 Introduction discussion: Oxidation: Si (and SiC) Only The ability to grow a high quality thermal oxide has propelled Si into the forefront
DEVELOPMENT OF HIGH EFFICIENCY FLEXIBLE CdTe SOLAR CELLS
 DEVELOPMENT OF HIGH EFFICIENCY FLEXIBLE CdTe SOLAR CELLS A.Romeo, M. Arnold, D.L. Bätzner, H. Zogg and A.N. Tiwari* Thin Films Physics Group, Laboratory for Solid State Physics, Swiss Federal Institute
Lecture 22: Integrated circuit fabrication
 Lecture 22: Integrated circuit fabrication Contents 1 Introduction 1 2 Layering 4 3 Patterning 7 4 Doping 8 4.1 Thermal diffusion......................... 10 4.2 Ion implantation.........................
Available online at ScienceDirect. Energy Procedia 77 (2015 )
") Available online at www.sciencedirect.com ScienceDirect Energy Procedia 77 (2015 ) 279 285 5th International Conference on Silicon Photovoltaics, SiliconPV 2015 21%-Efficient n-type rear-junction PERT
Available online at www.sciencedirect.com ScienceDirect Energy Procedia 77 (2015 ) 279 285 5th International Conference on Silicon Photovoltaics, SiliconPV 2015 21%-Efficient n-type rear-junction PERT
Halbleiter Prof. Yong Lei Prof. Thomas Hannappel
 Halbleiter Prof. Yong Lei Prof. Thomas Hannappel yong.lei@tu-ilmenau.de thomas.hannappel@tu-ilmenau.de http://www.tu-ilmenau.de/nanostruk/ Solid State Structure of Semiconductor Semiconductor manufacturing
Semiconductor Very Basics
 Semiconductor Very Basics Material (mostly) from Semiconductor Devices, Physics & Technology, S.M. Sze, John Wiley & Sons Semiconductor Detectors, H. Spieler (notes) July 3, 2003 Conductors, Semi-Conductors,
Two-dimensional Computer Modeling of Single Junction a-si:h Solar Cells
 Two-dimensional Computer Modeling of Single Junction a-si:h Solar Cells Changwoo Lee, Harry Efstathiadis, James E. Raynolds, Pradeep Haldar Energy and Environmental Applications Center (E2TAC) College
There are basically two approaches for bulk micromachining of. silicon, wet and dry. Wet bulk micromachining is usually carried out
 57 Chapter 3 Fabrication of Accelerometer 3.1 Introduction There are basically two approaches for bulk micromachining of silicon, wet and dry. Wet bulk micromachining is usually carried out using anisotropic
3.155J / 6.152J Micro/Nano Processing Technology TAKE-HOME QUIZ FALL TERM 2005
 3.155J / 6.152J Micro/Nano Processing Technology TAKE-HOME QUIZ FALL TERM 2005 1) This is an open book, take-home quiz. You are not to consult with other class members or anyone else. You may discuss the
Solar cells conversion efficiency enhancement techniques
 Optica Applicata, Vol. XXXVII, No. 1 2, 2007 Solar cells conversion efficiency enhancement techniques JOANNA PRAŻMOWSKA *, REGINA PASZKIEWICZ, RYSZARD KORBUTOWICZ, MATEUSZ WOŚKO, MAREK TŁACZAŁA Wrocław
Thin Films: Sputtering Systems (Jaeger Ch 6 & Ruska Ch 7,) Can deposit any material on any substrate (in principal) Start with pumping down to high
 Can deposit any material on any substrate (in principal) Start with pumping down to high") Thin Films: Sputtering Systems (Jaeger Ch 6 & Ruska Ch 7,) Can deposit any material on any substrate (in principal) Start with pumping down to high vacuum ~10-7 torr Removes residual gases eg oxygen from
Thin Films: Sputtering Systems (Jaeger Ch 6 & Ruska Ch 7,) Can deposit any material on any substrate (in principal) Start with pumping down to high vacuum ~10-7 torr Removes residual gases eg oxygen from
Solar cell technologies present and future
 Solar cell technologies present and future Joachim LUTHER, Armin ABERLE and Peter Wuerfel Solar Energy Research Institute of Singapore (SERIS) Nature Photonics Technology Conference, Tokyo, Japan 20 October
A discussion of crystal growth, lithography, etching, doping, and device structures is presented in
 Chapter 5 PROCESSING OF DEVICES A discussion of crystal growth, lithography, etching, doping, and device structures is presented in the following overview gures. SEMICONDUCTOR DEVICE PROCESSING: AN OVERVIEW
Semiconductor Manufacturing Technology. IC Fabrication Process Overview
 Semiconductor Manufacturing Technology Michael Quirk & Julian Serda October 00 by Prentice Hall Chapter 9 IC Fabrication Process Overview /4 Objectives After studying the material in this chapter, you
Passivation of silicon wafers by Silicon Carbide (SiC x ) thin film grown by sputtering
 thin film grown by sputtering") Available online at www.sciencedirect.com Energy Procedia 10 (2011 ) 71 75 European Materials Research Society Conference Symp. Advanced Inorganic Materials and Concepts for Photovoltaics Passivation of
Available online at www.sciencedirect.com Energy Procedia 10 (2011 ) 71 75 European Materials Research Society Conference Symp. Advanced Inorganic Materials and Concepts for Photovoltaics Passivation of
Amorphous silicon waveguides for microphotonics
 4 Amorphous silicon waveguides for microphotonics Amorphous silicon a-si was made by ion irradiation of crystalline silicon with 1 10 15 Xe ions cm 2 at 77 K in the 1 4 MeV energy range. Thermal relaxation
R Sensor resistance (Ω) ρ Specific resistivity of bulk Silicon (Ω cm) d Diameter of measuring point (cm)
 ρ Specific resistivity of bulk Silicon (Ω cm) d Diameter of measuring point (cm)") 4 Silicon Temperature Sensors 4.1 Introduction The KTY temperature sensor developed by Infineon Technologies is based on the principle of the Spreading Resistance. The expression Spreading Resistance derives
4 Silicon Temperature Sensors 4.1 Introduction The KTY temperature sensor developed by Infineon Technologies is based on the principle of the Spreading Resistance. The expression Spreading Resistance derives
Metallization deposition and etching. Material mainly taken from Campbell, UCCS
 Metallization deposition and etching Material mainly taken from Campbell, UCCS Application Metallization is back-end processing Metals used are aluminum and copper Mainly involves deposition and etching,
Point-contacting by Localised Dielectric Breakdown: A new approach for contacting solar cells
 Point-contacting by Localised Dielectric Breakdown: A new approach for contacting solar cells SPREE Public Seminar 20 th February 2014 Ned Western Supervisor: Stephen Bremner Co-supervisor: Ivan Perez-Wurfl
Atomic Layer Deposition(ALD)
") Atomic Layer Deposition(ALD) AlO x for diffusion barriers OLED displays http://en.wikipedia.org/wiki/atomic_layer_deposition#/media/file:ald_schematics.jpg Lam s market-leading ALTUS systems combine CVD
Atomic Layer Deposition(ALD) AlO x for diffusion barriers OLED displays http://en.wikipedia.org/wiki/atomic_layer_deposition#/media/file:ald_schematics.jpg Lam s market-leading ALTUS systems combine CVD
ZnO-based Transparent Conductive Oxide Thin Films
 IEEE EDS Mini-colloquium WIMNACT 32 ZnO-based Transparent Conductive Oxide Thin Films Weijie SONG Ningbo Institute of Material Technology and Engineering, Chinese Academy of Sciences, Ningbo, P. R. China
Semiconductor Technology
 Semiconductor Technology von A bis Z Metallization www.halbleiter.org Contents Contents List of Figures List of Tables II III 1 Metallization 1 1.1 Requirements on metallization........................
EFFECT OF HYDROGEN, CERIUM AND TUNGSTEN DOPING ON INDIUM OXIDE THIN FILMS FOR HETEROJUNCTION SOLAR CELLS
 EFFECT OF HYDROGEN, CERIUM AND TUNGSTEN DOPING ON INDIUM OXIDE THIN FILMS FOR HETEROJUNCTION SOLAR CELLS A. Valla, P. Carroy, F. Ozanne, G. Rodriguez & D. Muñoz 1 OVERVIEW Description of amorphous / crystalline
Abstract. Introduction
 Light Induced Degradation in Manufacturable Multi-crystalline Silicon Solar Cells Ben Damiani, Mohamed Hilali, and Ajeet Rohatgi University Center of Excellence for Photovoltaics Research Georgia Institute
Thin Films: Sputtering Systems (Jaeger Ch 6 & Ruska Ch 7,) Sputtering: gas plasma transfers atoms from target to substrate Can deposit any material
 Sputtering: gas plasma transfers atoms from target to substrate Can deposit any material") Thin Films: Sputtering Systems (Jaeger Ch 6 & Ruska Ch 7,) Sputtering: gas plasma transfers atoms from target to substrate Can deposit any material on any substrate (in principal) Start with pumping down
Thin Films: Sputtering Systems (Jaeger Ch 6 & Ruska Ch 7,) Sputtering: gas plasma transfers atoms from target to substrate Can deposit any material on any substrate (in principal) Start with pumping down
The Pennsylvania State University. The Graduate School. Graduate Program in Materials Science and Engineering
 The Pennsylvania State University The Graduate School Graduate Program in Materials Science and Engineering CHARACTERIZATION OF LASER FIRED CONTACTS, LASER DOPED EMITTERS, AND FIXED CHARGE PASSIVATION
Section 4: Thermal Oxidation. Jaeger Chapter 3. EE143 - Ali Javey
 Section 4: Thermal Oxidation Jaeger Chapter 3 Properties of O Thermal O is amorphous. Weight Density =.0 gm/cm 3 Molecular Density =.3E molecules/cm 3 O Crystalline O [Quartz] =.65 gm/cm 3 (1) Excellent
Deposition of AlOx/SiN stack and SiN for high efficient bifacial PERC solar cells using only one deposition system MAiA 3in1
 SNEC PV Power Expo and Conference 2017 Deposition of AlOx/SiN stack and SiN for high efficient bifacial PERC solar cells using only one deposition system MAiA 3in1 E. Vetter 1, T. Grosse 1, H.P. Sperlich
PHYSICAL ELECTRONICS(ECE3540) Brook Abegaz, Tennessee Technological University, Fall 2013
 Brook Abegaz, Tennessee Technological University, Fall 2013") PHYSICAL ELECTRONICS(ECE3540) Brook Abegaz, Tennessee Technological University, Fall 2013 1 Chapter 1 The Crystal Structure of Solids Physical Electronics: Includes aspects of the physics of electron movement
PHYSICAL ELECTRONICS(ECE3540) Brook Abegaz, Tennessee Technological University, Fall 2013 1 Chapter 1 The Crystal Structure of Solids Physical Electronics: Includes aspects of the physics of electron movement
SUPPLEMENTARY INFORMATION
 In the format provided by the authors and unedited. ARTICLE NUMBER: 16178 DOI: 10.1038/NENERGY.2016.178 Enhanced Stability and Efficiency in Hole-Transport Layer Free CsSnI3 Perovskite Photovoltaics Supplementary
Turn-key Production System for Solar Cells
 SOLARE Turn-key Production System for Solar Cells 02 Innovations for New Technologies provides technology solutions for both crystalline and thin-film highperformance solar cell platforms. Our production
Review Literature for Mosfet Devices Using High- K
 Review Literature for Mosfet Devices Using High- K Prerna Teaching Associate, Deptt of E.C.E., G.J.U.S. &T., INDIA prernaa.29@gmail.com Abstract: With the advancement of MOS devices over 40 years ago,
Low temperature deposition of thin passivation layers by plasma ALD
 1 Low temperature deposition of thin passivation layers by plasma ALD Bernd Gruska, SENTECH Instruments GmbH, Germany 1. SENTECH in brief 2. Low temperature deposition processes 3. SENTECH SI ALD LL System
Hei Wong.
 Defects and Disorders in Hafnium Oxide and at Hafnium Oxide/Silicon Interface Hei Wong City University of Hong Kong Email: heiwong@ieee.org Tokyo MQ2012 1 Outline 1. Introduction, disorders and defects
II. OPTIMIZATION OF SOLAR CELL
 Performance Analysis, Comparison and Optimization of Solar Cell Based on SiO 2 -Ph Seema Rani Priyanka Anand Sachin Kumar Dept. of ECE Dept. of ECE Dept. of Electronic Science BPSMV, Khanpur Kalan BPSMV,
Light-Induced Degradation of Thin Film Silicon Solar Cells
 Journal of Physics: Conference Series PAPER OPEN ACCESS Light-Induced Degradation of Thin Film Silicon Solar Cells To cite this article: F U Hamelmann et al 2016 J. Phys.: Conf. Ser. 682 012002 View the
5.8 Diaphragm Uniaxial Optical Accelerometer
 5.8 Diaphragm Uniaxial Optical Accelerometer Optical accelerometers are based on the BESOI (Bond and Etch back Silicon On Insulator) wafers, supplied by Shin-Etsu with (100) orientation, 4 diameter and
Recap of a-si and a-si cell technology Types of a-si manufacturing systems a-si cell and module manufacturing at Xunlight. Xunlight Corporation
 Thin-Film Silicon Technology and Manufacturing Recap of a-si and a-si cell technology Types of a-si manufacturing systems a-si cell and module manufacturing at Xunlight Xunlight products and installations
Transmission Mode Photocathodes Covering the Spectral Range
 Transmission Mode Photocathodes Covering the Spectral Range 6/19/2002 New Developments in Photodetection 3 rd Beaune Conference June 17-21, 2002 Arlynn Smith, Keith Passmore, Roger Sillmon, Rudy Benz ITT
Process steps for Field Emitter devices built on Silicon wafers And 3D Photovoltaics on Silicon wafers
 Process steps for Field Emitter devices built on Silicon wafers And 3D Photovoltaics on Silicon wafers David W. Stollberg, Ph.D., P.E. Research Engineer and Adjunct Faculty GTRI_B-1 Field Emitters GTRI_B-2
Specimen Preparation Technique for a Microstructure Analysis Using the Focused Ion Beam Process
 Specimen Preparation Technique for a Microstructure Analysis Using the Focused Ion Beam Process by Kozue Yabusaki * and Hirokazu Sasaki * In recent years the FIB technique has been widely used for specimen
Activation Behavior of Boron and Phosphorus Atoms Implanted in Polycrystalline Silicon Films by Heat Treatment at 250 C
 Japanese Journal of Applied Physics Vol. 44, No. 3, 2005, pp. 1186 1191 #2005 The Japan Society of Applied Physics Activation Behavior of Boron and Phosphorus Atoms Implanted in Polycrystalline Silicon
Design & Fabrication of a High-Voltage Photovoltaic Cell. Jennifer Felder
 SLAC-TN-12-021 Design & Fabrication of a High-Voltage Photovoltaic Cell Jennifer Felder Office of Science, Science Undergraduate Laboratory Internship (SULI) North Carolina State University SLAC National
Silicon Manufacturing
 Silicon Manufacturing Group Members Young Soon Song Nghia Nguyen Kei Wong Eyad Fanous Hanna Kim Steven Hsu th Fundamental Processing Steps 1.Silicon Manufacturing a) Czochralski method. b) Wafer Manufacturing
State of the art quality of a GeOx interfacial passivation layer formed on Ge(001)
") APPLICATION NOTE State of the art quality of a Ox interfacial passivation layer formed on (001) Summary A number of research efforts have been made to realize Metal-Oxide-Semiconductor Field Effect Transistors
APPLICATION NOTE State of the art quality of a Ox interfacial passivation layer formed on (001) Summary A number of research efforts have been made to realize Metal-Oxide-Semiconductor Field Effect Transistors
VLSI Technology Dr. Nandita Dasgupta Department of Electrical Engineering Indian Institute of Technology, Madras
 VLSI Technology Dr. Nandita Dasgupta Department of Electrical Engineering Indian Institute of Technology, Madras Lecture - 33 Problems in LOCOS + Trench Isolation and Selective Epitaxy So, we are discussing
Epitaxial Silicon Solar Cells
 2 Epitaxial Silicon Solar Cells Vasiliki Perraki Department of Electrical and Computer Engineering, University of Patras, Greece 1. Introduction Commercial solar cells are made on crystalline silicon wafers
Surface micromachining and Process flow part 1
 Surface micromachining and Process flow part 1 Identify the basic steps of a generic surface micromachining process Identify the critical requirements needed to create a MEMS using surface micromachining
Etching Mask Properties of Diamond-Like Carbon Films
 N. New Nawachi Diamond et al. and Frontier Carbon Technology 13 Vol. 15, No. 1 2005 MYU Tokyo NDFCT 470 Etching Mask Properties of Diamond-Like Carbon Films Norio Nawachi *, Akira Yamamoto, Takahiro Tsutsumoto
Implant Metrology for Bonded SOI Wafers Using a Surface Photo-Voltage Technique
 Implant Metrology for Bonded SOI Wafers Using a Surface Photo-Voltage Technique Adam Bertuch a, Wesley Smith a, Ken Steeples a, Robert Standley b, Anca Stefanescu b, and Ron Johnson c a QC Solutions Inc.,
Lecture 8. Deposition of dielectrics and metal gate stacks (CVD, ALD)
") Lecture 8 Deposition of dielectrics and metal gate stacks (CVD, ALD) Thin Film Deposition Requirements Many films, made of many different materials are deposited during a standard CMS process. Gate Electrodes
Lecture 8 Deposition of dielectrics and metal gate stacks (CVD, ALD) Thin Film Deposition Requirements Many films, made of many different materials are deposited during a standard CMS process. Gate Electrodes
Growth and Doping of SiC-Thin Films on Low-Stress, Amorphous Si 3 N 4 /Si Substrates for Robust Microelectromechanical Systems Applications
 Journal of ELECTRONIC MATERIALS, Vol. 31, No. 5, 2002 Special Issue Paper Growth and Doping of SiC-Thin Films on Low-Stress, Amorphous Si 3 N 4 /Si Substrates for Robust Microelectromechanical Systems