Module 3: Rainfall and Hydrology for Construction Site Erosion Control
|
|
|
- Bonnie Richardson
- 5 years ago
- Views:
Transcription


 Tractive force")

1 Module 3: Rainfall and Hydrology for Construction Site Erosion Control Robert Pitt Department of Civil, Construction, and Environmental Engineering University of Alabama Tuscaloosa, AL Rainfall and Hydrology Factors Affecting Erosion Rates Rainfall energy (rain intensity and duration) Tractive force (shear stress) of sheet and channel flow Runoff depth and velocity (to calculate shear stress for specific site conditions)
2 Hydrology Parameters Needed for the Design of Construction Site Erosion Control Practices Mulches water velocities and water depth Ditch liners water velocities and water depth Slope down shoots peak flow rates Diversion dikes and swales peak flow rates Filter fabric fences water velocities and hydrographs Sediment ponds water volume and hydrographs Thronson (1973) presented the following equation to estimate the erosion potential for individual rains: P dur R Accumulative Percentage of Total R P = rain depth in inches and, dur = rain duration in hours Rain Depth (inches) 3 4 >4 Huntsville Birmingham Tuscaloosa Montgomery Mobile Percentage of annual rains greater than 1 inch (there are about 100 to 125 rains a year in Alabama) Percentage of annual rains greater than 5 inches (there are about 100 to 125 rains a year in Alabama)

3 Number of Large Rains per Month in Birmingham, AL, over 41.5 year period 2.00 to to to 4.00 over 4.01 total January February March April May June July August September October November December Alabama Rainfall Conditions Are there specific rains that are most important from an erosion control viewpoint? (yes, about 5 rains a year are responsible for about half of the annual erosion. These are greater than about 1.5 inches in depth) Are there seasons of the year that are less prone to erosion than other times? (not really; June, July and August, plus October and November generally have had fewer of these large rains, but they may occur during any month) Intensity-Duration-Frequency curves used for hydrology calculations. Factors Affecting Runoff Rainfall The duration of the storm and the distribution of the rainfall during the storm are the two major factors affecting the peak rate of runoff. The rainfall amount affects the volume of runoff. Soil conditions antecedent moisture conditions generally affects the infiltration rate of the rainfall falling on the ground. Soil texture and compaction (structure) usually has the greatest effect on the infiltration. Surface cover the type and condition of the soil surface cover affects the rain energy transferred to the soil surface and can affect the infiltration rate also. Annual rainfall variations over Alabama (inches). The dots show the locations of the rain gages used in the analysis.
 is equal to the longest flow path (by time).")

4 Birmingham Intensity - Duration - Frequency (IDF) Curve Time of Concentration (t c ) The duration must be equal to the time of concentration for the drainage area. The time of concentration (t c ) is equal to the longest flow path (by time). If the t c is 5 min for a storm having a return period of 25 years, the associated peak intensity (which has a duration of 5 min) would be about 8.6 in/hr. If the t c for this same return period was 40 min, the peak rain intensity would be only 3.8 in/hr. Rainfall Frequency Rainfall frequency is commonly expressed as the average return period of the event. The value should be expressed as the probability of that event occurring in any one year. As an example, a 100-yr storm, has a 1% chance of occurring in any one year, while a 5-yr storm has a 20% chance of occurring in any one year. Multiple rare events may occur in any one year, but that is not very likely.


5 SCS (NRCS) Rainfall Distributions Data shown for Mobile, AL Zones of Different Rainfall Distributions Rainfall Distributions in the Southeastern U.S.

 Different Hydrologic Calculation Methods SCS (NRCS) TR-55 Curve Number Model of Rainfall vs.")

6 Probability of design storm (design return period) not being exceeded during the project life (design period). As an example, if a project life was 5 years, and a storm was not to be exceeded with a 90% probability, a 50 year design return period storm must be used. Probability of storm not being exceeded in a one year (T d ) construction period 50% 2.0 year 75% % 10 95% 20 Design storm return period (T) Different Hydrologic Calculation Methods SCS (NRCS) TR-55 Curve Number Model of Rainfall vs. Runoff Output Requirements Drainage Area Appropriate Method Peak Discharge Only Up to 20 acres Up to 2,000 acres Up to 5 square miles Up to 20 square miles Peak Discharge and Up to 2,000 acres Total Runoff Volume Up to 5 square miles Up to 20 square miles Runoff Hydrograph Up to 5 square miles Up to 20 square miles Rational Method 2 NRCS/SCS TR-20 Method 3 NRCS/SCS TR-55 Tabular Method 4 NRCS/SCS TR-55 Graphical Peak Discharge Method 5 COE HEC-1 Method (HEC- HMS)

7 Typical curve number (CN) values for urban areas. Typical CN Values for Pastures, Grasslands, and Woods Watershed Delineation Example X
 is located.")


 Depending on the age of the map, elevation data may be in English or Metric units.")

8 Watershed Delineation Example Watershed Delineation Hints X The determination of a watershed s area begins with the analysis of a topographic map of the region. The most downstream point of interest (a potential dam site, a culvert location, the outlet of a stream, where a stream reaches a river, etc.) is located. The area contributing flow to that site is then identified by application of a few simple rules: Water flows downhill Water tends to flow perpendicularly across the contour lines Ridges are indicated by contour V s pointing downhill Drainages are indicated by contour V s pointing upstream. Watershed Delineation Process Information Sources USGS Topographic Maps The fundamental source of data for delineating and studying watersheds is the U.S. Geological Survey Quadrangle map. Each Quad Sheet map covers 7.5 minutes of longitude and latitude. These maps give a wealth of information including topographic contour lines, locations of cities, buildings, roads, road types, railroads, pipelines, water bodies, forested land, stream networks, and USGS stream gauging stations and benchmarks. Quad sheet maps typically have a scale of 1:24,000 (i.e. 1 inch on the map = 24,000 inches on land) Depending on the age of the map, elevation data may be in English or Metric units. Typically, in the Midwest, the contour intervals of the elevation data are 5 feet or 1.5 meter, in the south, the contour intervals may be 20 ft. For watershed delineation, quad sheet maps offer us the best starting point. Detailed site maps having 1 to 5 ft contour intervals are usually required for final analyses.


.")

9 1. Trace out the main drainage pathways upstream from the point of concern. 2. Using a different color, trace the drainage pathways draining away from the area. 3. Extend the obvious drainage paths and locate the peaks in the contours between these drainage systems 4. Starting at the bottom, connect the peaks between the drainage systems along the ridges to delineate the watershed boundary. HSG A B C D Site soil information also needed for TR-55 Soil Textures Sand, loamy sand, or sandy loam Silt, silt loam or loam Sandy clay loam Clay loam, silty clay loam, sandy clay, silty clay, or clay Group A soils have low runoff potential and high infiltration rates, even when thoroughly wetted. They consist chiefly of deep, well to excessively drained sands or gravels and have a high rate of water transmission (greater than 0.30 in/hr). Group B soils have moderate infiltration rates when thoroughly wetted and consist chiefly of moderately deep to deep, moderately well to well drained soils, with moderately fine to moderately coarser textures. These soils have a moderate rate of water transmission (0.15 to 0.30 in/hr).
. Group D soils have high runoff potential.")
. So")
10 Soil Surveys Group C soils have low infiltration rates when thoroughly wetted and consist chiefly of soils with a layer that impedes downward movement of water and soils with moderately fine to fine textures. These soils have a low rate of water transmission (0.05 to 0.15 in/hr). Group D soils have high runoff potential. They have very low infiltration rates when thoroughly wetted and consist chiefly of clay soils with a high swelling potential, soils with a permanent high water table, soils with a claypan or clay layer at or near the surface, and shallow soils over nearly imperious material. These soils have a very low rate of water transmission (0 to 0.05 in/hr). Soil surveys have been generated by the U.S. Department of Agriculture (National Resource Conservation Service formerly the Soil Conservation Service) and are typically available through the county extension office. Information typically available in a soil survey: Soil type by general area Descriptions of the various soil types Tables of information regarding the various soil types Soil classification (Hydrologic Soil Group A, B, C, and D) Soil Survey Background Information: Soil scientists observed the steepness, length, and shape of the slopes; the general pattern of drainage; the kinds of crops and native plants; and the kinds of bedrock. They dug many holes to study the soil profile, which is the sequence of natural layers, or horizons, in a soil. The profile extends from the surface down into the material in which the soil formed. The material is devoid of roots and other living organisms and has not been changed by other biological activity. Some Alabama Soil Surveys are available on-line at: (some, including Jefferson and Tuscaloosa counties, are just scans of the older reports and maps) General Soil Map for Alabama
, Cripple")


11 Tuscaloosa, AL, soil survey (USDA), Cripple Creek Church area. Small numbers are the soil types, while the larger numbers are the quadsheet section numbers. An example of an older USDA soil map (uses symbols to describe soil groups, slopes, and existing severity of erosion)
12 Soil number (name) and depth Hydrologic Soil Group Depth to Bedrock (inches) Permeability (in/hr) Erosion Factor, k Tolerable Soil Loss, T (tons/ac/yr) Organic Matter (%) 21 (Montevallo) D Soil Building Site Development Limitations Shallow Excavations Local Streets and Roads Dwellings with Basements Lawns and Landscaping 23 (Nauvoo) B (Smithdale) B > (Montevallo) 23 (Nauvoo) 33 (Smithdale) Severe (depth to rock, slope) Slight Severe (slope) Moderate (low strength) Severe (depth to rock, slope) Slight Moderate (slope) Moderate (slope) Moderate (slope) Severe (droughty, slope, thin soil layer) Slight Moderate (slope) Time of Concentration (t c ) The duration must be equal to the time of concentration for the drainage area. The time of concentration (t c ) is equal to the longest flow path (by time). If the t c is 5 min for a storm having a return period of 25 years, the associated peak intensity (which has a duration of 5 min) would be about 8.6 in/hr. If the t c for this same return period was 40 min, the peak rain intensity would be only 3.8 in/hr. Time of Concentration Estimates The TR-55 procedures estimate t c using three flow segment types: Sheetflow (maximum of 300 ft; WinTR-55 has a maximum of 150 ft now, similar to some state agency restrictions) Shallow concentrated flow (paved or unpaved surfaces Channel flow (using Manning s equation) Candidate t c pathways are drawn on the site map and the travel times for the three flow segments of each pathway are calculated. The t c for the drainage area is the longest travel time calculated.
13 Area of watershed contributing runoff as a function of flow travel time (T t ) In this example, 13 minutes is the watershed time of concentration, but almost all of the watershed area is contributing runoff at 9 or 10 minutes. McCuen 1989 McCuen 1989 Only a rain duration equal to the T c produces the maximum peak runoff rate at the critical rain intensity. Shorter duration rains do not produce runoff from the complete area, while longer duration rains do not have any additional contributing areas. Rains having durations equal to the T c must be used in drainage designs as they produce the critical intensity for the area and the level of service (likelihood of failure in any one year). Longer duration rains have lower intensities for the same service, while shorter duration rains do not have the complete drainage area contributing flows during that time period.
14 Figure illustrating sheetflow travel time for dense grass surfaces, for varying slopes and flow lengths. nl P S T t Figure illustrating shallow concentrated flow velocities for paved and unpaved surfaces and for different slopes. Channel Flow using Manning s Equation: r V n s V = average velocity (ft/s), and r = hydraulic radius (ft) and is equal to a/pw a = cross sectional flow area (ft2) pw = wetted perimeter (ft) s = slope of hydraulic grade line (channel slope, ft/ft) n = Manning roughness coefficient (for open channel flow) NRCS Travel Time Example: A-B sheetflow (100 ft) B-C shallow concentrated flow (1,400 ft) C-D channel flow (7,300 ft)
 Time of concentration (hours) Travel time through downstream segments (hours) 24-hr rainfall total for design storm Rainfall distribution")
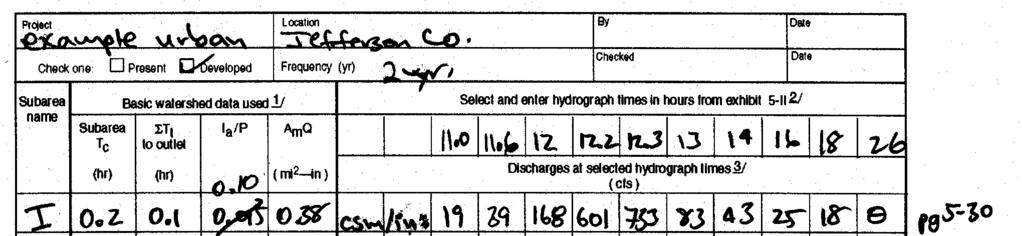
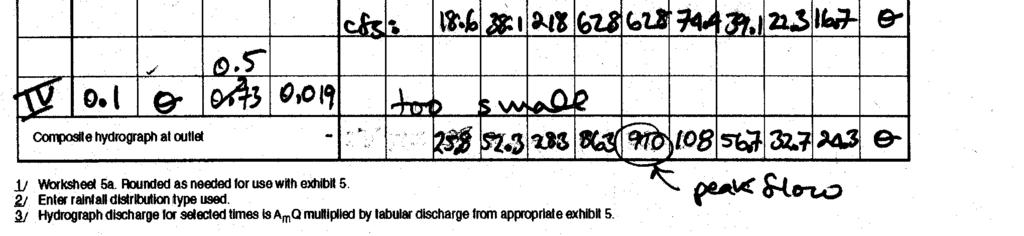
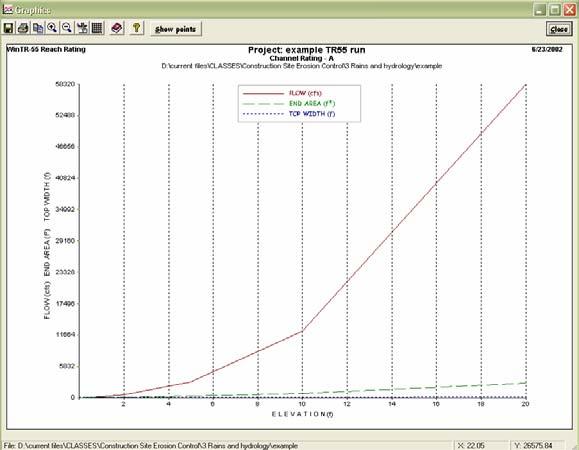
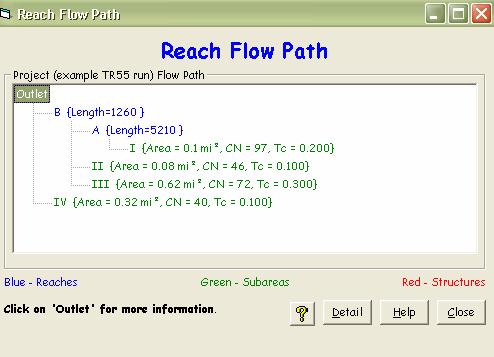
15 Tabular Hydrograph Method The NRCS TR-55 Tabular Hydrograph Method uses watershed information and a single design storm to predict the peak flow rate, the total runoff volume, and the hydrograph. Information needed includes: Drainage area (square miles) Time of concentration (hours) Travel time through downstream segments (hours) 24-hr rainfall total for design storm Rainfall distribution type Runoff curve number (and associated initial abstraction) Layout of Subwatersheds for NRCS Example
16 The initial abstraction values (mostly detention storage) are a direct function of the curve number. The dimensionless unit hydrograph is selected from tables in TR-55 Example Urban Watershed 1) subdivide the watershed into relatively homogeneous subareas
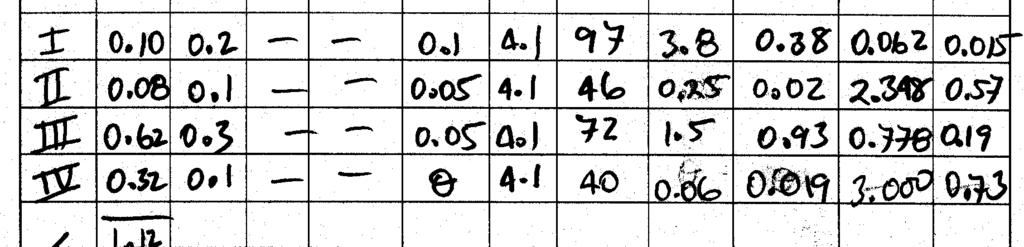
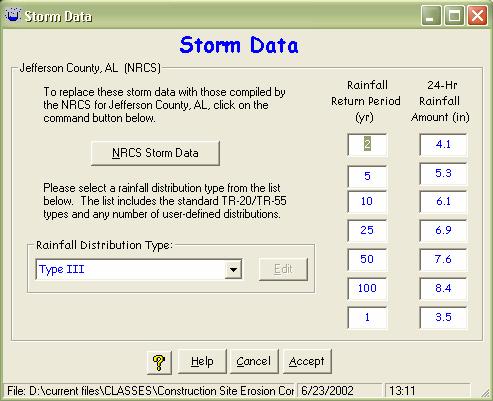
17 2) calculate the drainage area for each subarea: I 0.10 mi 2 II 0.08 III 0.6 IV 0.32 Total: ) calculate the time of concentration (Tc) for each subarea I 0.2 hrs II 0.1 III 0.3 IV 0.1 4) calculate the travel time (Tt) from each subarea discharge location to the location of interest (outlet of total watershed in this example): I 0.1 hrs II 0.05 III 0.05 IV 0 5) select the curve number (CN) for each subarea: I Strip commercial, all directly connected CN = 97 II Medium density residential area, grass swales CN = 46 III Medium density residential area, curbs and CN = 72 gutters IV Low density residential area, grass swales CN = 40 9) determine Ia for each subarea (assumes Ia = 0.2 S) (SCS table 5-1): 6) rainfall distribution: Type II for all areas 7) 24-hour rainfall depth for storm: 4.1 inches 8) calculate total runoff (inches) from CN and rain depth (from SCS fig. 2-1) I CN = 97 P = 4.1 in. Q = 3.8 in. II CN = 46 P = 4.1 in. Q = 0.25 III CN = 72 P = 4.1 in. Q = 1.5 IV CN = 40 P = 4.1 in. Q = 0.06 I CN = 97 Ia = in. II CN = 46 Ia = in. III CN = 72 Ia = in. IV CN = 40 Ia = in. 10) calculate the ratio of Ia to P I Ia/P = 0.062/4.1 = II Ia/P = 2.348/4.1 = 0.57 III Ia/P = 0.778/4.1 = 0.19 IV Ia/P = 3.000/4.1 = ) use worksheets SCS 5a and 5b to summarize above data and to calculate the composite hydrograph

18


19

20


 37.4 0.")
 14.6 0.4 11.")
21 Example Applications to Construction Sites Upslope and downslope drainage areas for construction site. Subdrainages on and near construction site affecting control design. Upslope Subdrainage Area Characteristics Calculation objective Acres Cover n Flow path slope CN t c (min) U1 Direct to site Hydrograph (to be combined with U2 and U3) % U2 Diversion to site stream Peak flow rate and hydrograph (to be combined with U1 and U3) U3 Diversion to site stream Peak flow rate and hydrograph (to be combined with U1 and U2)
22 Upslope Subdrainage Area TR-55 Calculations ( 5-year storm) Calculations for areas draining to sediment pond Area Notation Location U1 Upslope direct to on site stream U2 Upslope diversion to on site stream U3 Upslope diversion to on site stream Direct Runoff, Q (inches) area-depth (AmQ), (mi 2 - inches) Peak unit area flow rate (csm/in) Peak discharge (ft 3 /sec) Etc. Acceptable Levels of Protection for Different Site Activities (1 year construction period) Example Acceptable Failure Rate Design Storm Return Period 24-hr Rain Depth Diversion 25% 6.5 years 5.5 inches channels Main site 5% channel Site slopes 10% Site filter 50% fence Sediment pond 5% and 1% 20 and and 8.4
, q is the unit width flow rate (Q/W, the total flow rate, in ft 3 /sec, divided by the slope width, in ft.")
23 Runoff Water Depth (needed for sheetflow calculations on slopes for slope protection) qn y 1.49s y is the flow depth (in feet), q is the unit width flow rate (Q/W, the total flow rate, in ft 3 /sec, divided by the slope width, in ft.) n is the sheet flow roughness coefficient, and s is the slope (as a fraction) Homework Problem: 1) Determine the watershed delineation above the cross on the attached map (hint: it goes off the map very slightly on the bottom edge). 2) Calculate the peak runoff rate for the 25 year storm (Birmingham area), assuming B soils, and good wood cover (make other reasonable assumptions as needed). 3) Conduct a similar watershed analysis for the watershed containing your construction site (subdividing the area into upstream, on-site, and downstream areas). Note: 20 ft contour intervals Watershed boundary based on topographic information. Highlighted main drainage above location of interest, and adjacent drainages.
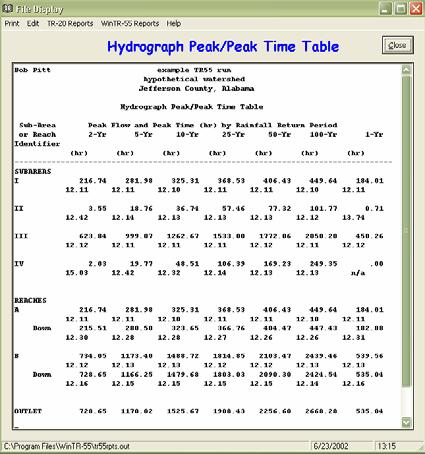
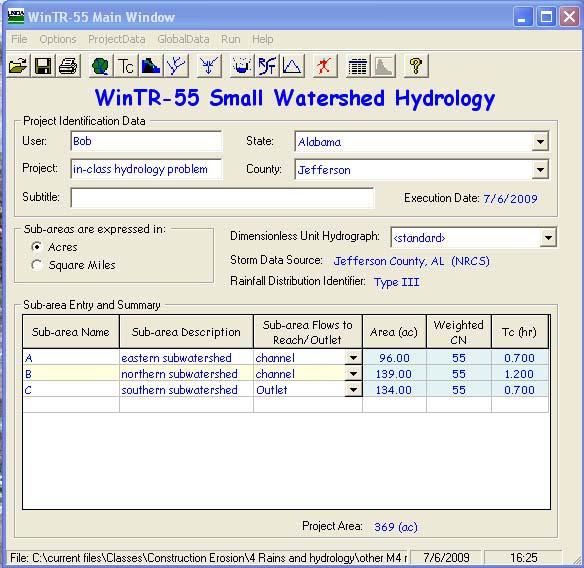
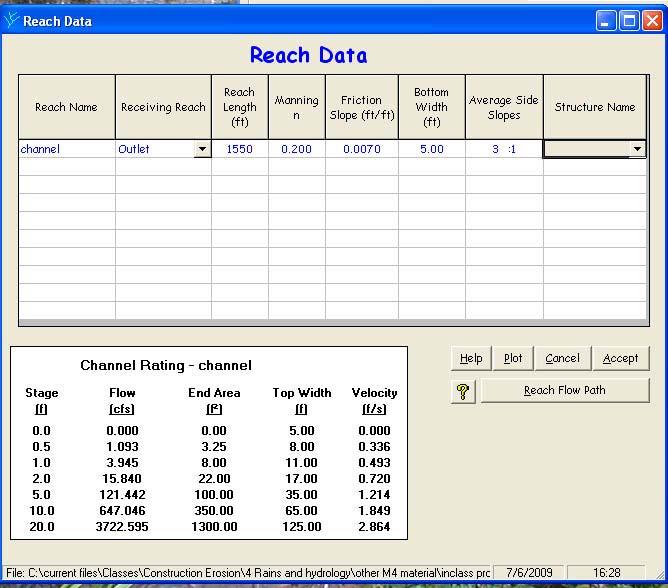
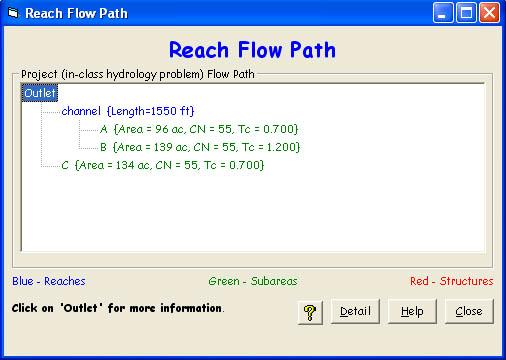
24 Subdivided into 3 subwatersheds for more appropriate hydrologic analyses. Need area, CN, and Tc for each surbarea, then can use WinTR-55 to calculate the hydrographs from each and the combined hydrograph. Need to evaluate alternative flow drainage pathways to identify the likely Tc. In this case, four candidate paths are examined. Subwatershed A area: 96 acres CN (B soils and good woods cover): 55 Tc: 0.7 hrs alternative flow paths need to be evaluated (there is no specific channel, so only sheetflow and shallow concentrated flow) flowpath A1 (woods, light underbrush): sheetflow: 150 ft at 4.7% 19 min shallow conc flow: 1800 ft at 4.7 % 3.9 ft/sec and 1800 ft = 460 sec = 8 min 950 ft at 0.5% 1.1 ft/sec and 950 ft = 860 sec = 14 min total travel time: 41 min = 0.7 hrs flowpath A3 (woods, light underbrush): sheetflow: 150 ft at 3.1% 22 min shallow conc flow: 1030 ft at 6.8% 3.9 ft/sec and 1030 ft = 260 sec = 4 min 1420 ft at 2.1% 2.0 ft/sec and 1420 ft = 710 sec = 12 min total travel time: 38 min = 0.6 hrs flowpath A4 (woods, light underbrush): sheetflow: 150 ft at 1.9% 26 min shallow conc flow: 370 ft at 1.9% 2.2 ft/sec and 370 ft = 170 sec = 3 min 2540 ft at 3.2% 2.8 ft/sec and 2540 ft = 910 sec = 15min total travel time: 44 min = 0.7 hrs flowpath A2 (woods, light underbrush): sheetflow: 150 ft at 7.8% 18 min shallow conc flow: 860 ft at 5.8% 3.3 ft/sec and 860 ft = 260 sec = 4 min 950 ft at 0.5% 1.1 ft/sec and 950 ft = 860 sec = 14 min total travel time: 36 min = 0.6 hrs
25 Subwatershed B area: 139 acres CN (B soils and good woods cover): 55 Tc: 1.2 hrs alternative flow paths need to be evaluated (there is no specific channel, so only sheetflow and shallow concentrated flow) flowpath B1 (woods, light underbrush): sheetflow: 150 ft at 1.4% 31 min shallow conc flow: 740 ft at 1.4 % 1.5 ft/sec and 740 ft = 490 sec = 8 min 3100 ft at 1.3% 1.6 ft/sec and 3100 ft = 1940 sec = 32 min total travel time: 71 min = 1.2 hrs flowpath B2 (woods, light underbrush): sheetflow: 150 ft at 1.4% 31 min shallow conc flow: 820 ft at 8.5% 5.0 ft/sec and 820 ft = 160 sec = 3 min 2110 ft at 1.4% 2.0 ft/sec and 2110 ft = 1060 sec = 18 min total travel time: 52 min = 0.9 hrs flowpath B3 (woods, light underbrush): sheetflow: 150 ft at 1.0% 35 min shallow conc flow: 240 ft at 3.0% 2.8 ft/sec and 240 ft = 85 sec = 1 min 3820 ft at 1.3% 2.0 ft/sec and 3820 ft = 1910 sec = 32 min total travel time: 68 min = 1.1 hrs
26 Subwatershed C area: 134 acres CN (B soils and good woods cover): 55 Tc: 0.7 hrs flowpath C1 (woods, light underbrush): sheetflow: 150 ft at 2.4% 9 min shallow conc flow: 2530 ft at 3.6 % 2.8 ft/sec and 2530 ft = 900 sec = 15 min 1550 ft at 0.7% 1.4 ft/sec and 1550 ft = 1110 sec = 18 min total travel time: 42 min = 0.7 hrs flowpath C2 (woods, light underbrush): sheetflow: 150 ft at 9.1% 14 min shallow conc flow: 830 ft at 8.3% 3.8 ft/sec and 830 ft = 220 sec = 4 min 1550 ft at 0.7% 1.4 ft/sec and 1550 ft = 1110 sec = 18 min total travel time: 36 min = 0.6 hrs

27
28
Runoff Calculations. Time of Concentration (T c or t c ) from one location to another within a watershed. Travel
 from one location to another within a watershed. Travel") Runoff Calculations Bob Pitt University of Alabama and Shirley Clark Penn State Harrisburg Time of Concentration and Travel Time (based on Chapter 3 of TR-55) Time of Concentration (T c ): time required
Runoff Calculations Bob Pitt University of Alabama and Shirley Clark Penn State Harrisburg Time of Concentration and Travel Time (based on Chapter 3 of TR-55) Time of Concentration (T c ): time required
Hydrology for Drainage Design. Design Considerations Use appropriate design tools for the job at hand:
 Hydrology for Drainage Design Robert Pitt Department of Civil and Environmental Engineering University of Alabama Tuscaloosa, AL Objectives for Urban Drainage Systems are Varied Ensure personal safety
Module 3 and Module 4 Watershed Analysis and RUSLE Calculation. Noboru Togawa. Presented to: Dr. Pitt Construction Site Erosion Control
 Module 3 and Module 4 Watershed Analysis and RUSLE Calculation by Presented to: Dr. Pitt Construction Site Erosion Control Department of Civil, Construction, and Environmental Engineering The University
STORMWATER HYDROLOGY
 ..CHAPTER.. STORMWATER HYDROLOGY 3.1 Introduction to Hydrologic Methods Hydrology is the science dealing with the characteristics, distribution, and movement of water on and below the earth's surface and
LAKE COUNTY HYDROLOGY DESIGN STANDARDS
 LAKE COUNTY HYDROLOGY DESIGN STANDARDS Lake County Department of Public Works Water Resources Division 255 N. Forbes Street Lakeport, CA 95453 (707)263-2341 Adopted June 22, 1999 These Standards provide
Chapter Introduction. 5.2 Computational Standard Methods HYDROLOGY
 Chapter 5. HYDROLOGY 5.1 Introduction The definition of hydrology is the scientific study of water and its properties, distribution, and effects on the earth s surface, in the soil and the atmosphere.
0.0. Pervious CN = 40. (Unconnected impervious) (Total impervious) Total impervious area (percent) Composite CN
 (Total impervious) Total impervious area (percent) Composite CN") Figure 2-3 Composite CN with connected impervious area. 100 Composite CN 90 80 70 60 Pervious CN = 90 80 70 60 50 40 50 40 0 10 20 30 40 50 60 70 80 90 100 Connected impervious area (percent) Figure 2-4
Figure 2-3 Composite CN with connected impervious area. 100 Composite CN 90 80 70 60 Pervious CN = 90 80 70 60 50 40 50 40 0 10 20 30 40 50 60 70 80 90 100 Connected impervious area (percent) Figure 2-4
WinTR-55 Small Watershed Hydrology
 WinTR-55 Small Watershed Hydrology Modeling Single Sub-area Watersheds (Part 2) We ve looked at the minimum data entry requirements and how we can enter curve numbers and times of concentration directly
Rational Method Hydrological Calculations with Excel COURSE CONTENT
 Rational Method Hydrological Calculations with Excel Harlan H. Bengtson, PhD, P.E. COURSE CONTENT 1. Introduction Calculation of peak storm water runoff rate from a drainage area is often done with the
Table of Contents CHAPTER. Chapter 2 Hydrologic Analysis. 2.1 Estimating Runoff
 CHAPTER Table of Contents 2 Chapter 2 Hydrologic Analysis 2.1 Estimating Runoff 2.1.1 Introduction to Hydrologic Methods...2.1-1 2.1.2 Symbols and Definitions...2.1-4 2.1.3 Rainfall Estimation...2.1-5
iswm TM Technical Manual Hydrology:
 : 1.0 2.0 Downstream Assessment 3.0 Streambank Protection 4.0 Water Balance 5.0 Rainfall Tables 6.0 Hydrologic Soils Data Table of Contents 1.0... HO-1 1.1 Estimating Runoff... HO-1 1.1.1 Introduction
Names: ESS 315. Lab #6, Floods and Runoff Part I Flood frequency
 Names: ESS 315 Lab #6, Floods and Runoff Part I Flood frequency A flood is any relatively high flow of water over land that is not normally under water. Floods occur at streams and rivers but can also
Typical Local Erosion Control Requirements (Storm Water Management Authority, Inc.)
") Module 2: Selection of Controls and Site Planning for Construction Site Erosion Prevention Robert Pitt Department of Civil, Construction, and Environmental Engineering University of Alabama Tuscaloosa,
Module 2: Selection of Controls and Site Planning for Construction Site Erosion Prevention Robert Pitt Department of Civil, Construction, and Environmental Engineering University of Alabama Tuscaloosa,
APPENDIX F RATIONAL METHOD
 7-F-1 APPENDIX F RATIONAL METHOD 1.0 Introduction One of the most commonly used procedures for calculating peak flows from small drainages less than 200 acres is the Rational Method. This method is most
MVP 17.3 WATER BAR END TREATMENT SIZING AND DETAILS 1/22/18
 MVP 17.3 WATER BAR END TREATMENT SIZING AND DETAILS 1/22/18 The purpose of this detail is to document the methodology developed to size the length of the water bar end treatments to ensure flow leaving
Ponds Planning, Design, Construction
 United States Department of Agriculture Natural Resources Conservation Service Ponds Planning, Design, Construction Agriculture Handbook Number 590 Estimating storm runoff The amount of precipitation,
CHAPTER 3 STORMWATER HYDROLOGY. Table of Contents SECTION 3.1 METHODS FOR ESTIMATING STORMWATER RUNOFF
 CHAPTER 3 STORMWATER HYDROLOGY Table of Contents SECTION 3.1 METHODS FOR ESTIMATING STORMWATER RUNOFF 3.1.1 Introduction to Hydrologic Methods...3.1-1 3.1.2 Symbols and Definitions...3.1-3 3.1.3 Rainfall
Appendix 10-A. Optional Recharge Volume Approach
 Appendix 10-A Optional Recharge Volume Approach Table of Contents APPENDIX SECTION HEADINGS 10-A.0 INTRODUCTION 10-A-2 10-A.1 Horsely Method for Determining Recharge Volumes 10-A-2 10-A.1.1 Basis for Determining
Detention Pond Design Considering Varying Design Storms. Receiving Water Effects of Water Pollutant Discharges
 Detention Pond Design Considering Varying Design Storms Land Development Results in Increased Peak Flow Rates and Runoff Volumes Developed area Robert Pitt Department of Civil, Construction and Environmental
What is runoff? Runoff. Runoff is often defined as the portion of rainfall, that runs over and under the soil surface toward the stream
 What is runoff? Runoff Runoff is often defined as the portion of rainfall, that runs over and under the soil surface toward the stream 1 COMPONENTS OF Runoff or STREAM FLOW 2 Cont. The types of runoff
Stormwater Analysis Report
 Stormwater Analysis Report Solar Panel Array Temple Street (Rt. 14) West Boylston, MA February 24, 216 SITE Prepared for: West Boylston Municipal Lighting Plant 4 Crescent Street West Boylston, MA 1583
Precipitation Surface Cover Topography Soil Properties
 Precipitation Surface Cover Topography Soil Properties Intrinsic capacity of rainfall to cause erosion Influenced by Amount, intensity, terminal velocity, drop size and drop size distribution of rain.
Overview of NRCS (SCS) TR-20 By Dr. R.M. Ragan
 TR-20 By Dr. R.M. Ragan") Overview of NRCS (SCS) TR-20 By Dr. R.M. Ragan TR-20 is a computer program for the simulation of runoff occurring from a single storm event. The program develops flood hydrographs from runoff and routes
Overview of NRCS (SCS) TR-20 By Dr. R.M. Ragan TR-20 is a computer program for the simulation of runoff occurring from a single storm event. The program develops flood hydrographs from runoff and routes
CE 585. Construction Site Erosion Control. The University of Alabama. Tuscaloosa, AL. New Chevrolet and Cadillac Dealership.
 CE 585 Construction Site Erosion Control The University of Alabama Tuscaloosa, AL New Chevrolet and Cadillac Dealership Jasper, AL Andrew Kennedy July 10, 2007 0 Table of Contents 1. Introduction.. 1 2.
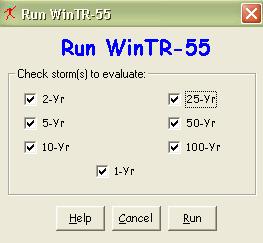
5/11/2007. WinTR-55 for Plan Reviewers Small Watershed Hydrology Hydrology Terms and Definitions
 WinTR-55 for Plan Reviewers Small Watershed Hydrology Hydrology Terms and Definitions 1 Course Outline Overview Review of Hydrology Terms and Definitions Modeling Single Sub-area Watersheds Multiple Sub-area
Module 6 Temporary Pond and Silt Fence. Noboru Togawa. Presented to: Dr. Pitt Construction Site Erosion Control
 Module 6 Temporary Pond and Silt Fence by Presented to: Dr. Pitt Construction Site Erosion Control Department of Civil, Construction, and Environmental Engineering The University of Alabama Tuscaloosa,
Erosion Controls Control Site Discharges
 Sedimentation and Filter Fences for Downslope Control at Construction Sites Robert Pitt Department of Civil and Environmental Engineering University of Alabama Tuscaloosa, AL Erosion Controls Control Site
SECTION IV WATERSHED TECHNICAL ANALYSIS
 A. Watershed Modeling SECTION IV WATERSHED TECHNICAL ANALYSIS An initial step in the preparation of this stormwater management plan was the selection of a stormwater simulation model to be utilized. It
Introduction to Storm Sewer Design
 A SunCam online continuing education course Introduction to Storm Sewer Design by David F. Carter Introduction Storm sewer systems are vital in collection and conveyance of stormwater from the upstream
HYDROLOGIC CONSIDERATIONS. 22 nd Annual Nonpoint Source Pollution Conference Saratoga Springs, NY
 LOW IMPACT DEVELOPMENT HYDROLOGIC CONSIDERATIONS 22 nd Annual Nonpoint Source Pollution Conference Saratoga Springs, NY May 18, 2011 PRESENTATION AGENDA Introduction Definitions Discuss Impacts to Hydrologic
Chapter H. Introduction to Surface Water Hydrology and Drainage for Engineering Purposes
 Chapter H. Introduction to Surface Water Hydrology and Drainage for Engineering Purposes As seen in Figure H.1, hydrology is a complex science that deals with the movement of water between various stages
FORT COLLINS STORMWATER CRITERIA MANUAL Hydrology Standards (Ch. 5) 1.0 Overview
 1.0 Overview") Chapter 5: Hydrology Standards Contents 1.0 Overview... 1 1.1 Storm Runoff Determination... 1 1.2 Design Storm Frequencies... 1 1.3 Water Quality Storm Provisions... 2 1.4 Design Storm Return Periods...
Chapter 5: Hydrology Standards Contents 1.0 Overview... 1 1.1 Storm Runoff Determination... 1 1.2 Design Storm Frequencies... 1 1.3 Water Quality Storm Provisions... 2 1.4 Design Storm Return Periods...
ORDINANCE APPENDIX F STORMWATER MANAGEMENT DESIGN CRITERIA
 ORDINANCE APPENDIX F STORMWATER MANAGEMENT DESIGN CRITERIA TABLE F-1 DESIGN STORM RAINFALL AMOUNT FIGURE F-1 ALTERNATING BLOCK METHOD FOR RAINFALL DISTRIBUTION FIGURE F-2 PENNDOT DELINEATED REGIONS FIGURE
APPENDIX IV. APPROVED METHODS FOR QUANTIFYING HYDROLOGIC CONDITIONS OF CONCERN (NORTH ORANGE COUNTY)
") APPENDIX IV. APPROVED METHODS FOR QUANTIFYING HYDROLOGIC CONDITIONS OF CONCERN (NORTH ORANGE COUNTY) Hydromodification design criteria for the North Orange County permit area are based on the 2- yr, 24-hr
APPENDIX IV. APPROVED METHODS FOR QUANTIFYING HYDROLOGIC CONDITIONS OF CONCERN (NORTH ORANGE COUNTY) Hydromodification design criteria for the North Orange County permit area are based on the 2- yr, 24-hr
Technical Memorandum
 Tucson Office 3031 West Ina Road Tucson, AZ 85741 Tel 520.297.7723 Fax 520.297.7724 www.tetratech.com Technical Memorandum To: Kathy Arnold From: Greg Hemmen, P.E. Company: Rosemont Copper Company Date:
Highway Surface Drainage
 Highway Surface Drainage R obert D. M iles, Research Engineer Joint Highway Research Project, and Assistant Professor of Highway Engineering, School of Civil Engineering Purdue University IN T R O D U
This page intentionally left blank
 REFERENCE DOCUMENTS This page intentionally left blank TABLE OF CONTENTS REFERENCE DOCUMENTS REFERENCE DOCUMENT A: MEAN SEASONAL PRECIPITATION MAP R 1 REFERENCE DOCUMENT B: K FACTOR R 2 REFERENCE DOCUMENT
MODULE 1 RUNOFF HYDROGRAPHS WORKSHEET 1. Precipitation
 Watershed MODULE 1 RUNOFF HYDROGRAPHS WORKSHEET 1 A watershed is an area of land thaaptures rainfall and other precipitation and funnels it to a lake or stream or wetland. The area within the watershed
Ponds: planning, design, and construction
 Ponds: planning, design, and construction Ponds for many purposes: Fish Production Recreation Water Supply Esthetics Wildlife Habitat Natural ponds: Formed in natural depressions in the landscape Not man-made
Peak discharge computation
 Ia/P 4 Peak Dischage Method Graphical Peak Discharge Method This chapter presents the Graphical Peak Discharge method for computing peak discharge from rural and urban areas. The Graphical method was developed
FAST WATER / SLOW WATER AN EVALUATION OF ESTIMATING TIME FOR STORMWATER RUNOFF
 FAST WATER / SLOW WATER AN EVALUATION OF ESTIMATING TIME FOR STORMWATER RUNOFF Factors Affecting Stormwater Runoff: Rainfall intensity % Impervious surfaces Watershed size Slope Soil type, soil compaction
RETENTION BASIN EXAMPLE
 -7 Given: Total Tributary Area = 7.5 ac o Tributary Area within Existing R/W = 5.8 ac o Tributary Area, Impervious, Outside of R/W = 0.0 ac o Tributary Area, Pervious, Outside of R/W = 1.7 ac o Tributary
INITIAL RUN-ON AND RUN-OFF CONTROL PLAN 40 C.F.R. PART 257
 INITIAL RUN-ON AND RUN-OFF CONTROL PLAN 40 C.F.R. PART 257.81 PLANT BOWEN PRIVATE INDUSTRY SOLID WASTE DISPOSAL FACILITY (ASH LANDFILL) GEORGIA POWER COMPANY EPA s Disposal of Coal Combustion Residuals
6.0 Runoff. 6.1 Introduction. 6.2 Flood Control Design Runoff
 October 2003, Revised February 2005 Chapter 6.0, Runoff Page 1 6.1 Introduction 6.0 Runoff The timing, peak rates of discharge, and volume of stormwater runoff are the primary considerations in the design
APPENDIX A: STORMWATER HYDROLOGY
 APPENDIX A: STORMWATER HYDROLOGY In low impact development (LID), the objective of stormwater control measures (SCMs) is to mimic or replicate the hydrologic function of a natural system. This approach
Design of Stormwater Wetlands
 Hydraulic & Hydrologic Stormwater Engineering Design of Stormwater Wetlands Jon Hathaway, EI Extension Associate NCSU Bio. And Ag. Engineering 6 Step Process 1. Watershed Analysis (Runoff Volume and Peak
Watershed Delineation Techniques
 Watershed Delineation Techniques Stacy D. Dehne DATCP Engineer February 2008 1 What Is a Watershed? An Area of Land that Drains to a given location February 2008 2 Contour Map Features Contour Maps: Represent
CE 585 Construction Site Erosion Control The University of Alabama Tuscaloosa, AL. New Chevrolet and Cadillac Dealership Jasper, AL
 CE 585 Construction Site Erosion Control The University of Alabama Tuscaloosa, AL New Chevrolet and Cadillac Dealership Jasper, AL Andrew Kennedy Homework #6 July 24, 2007 0 Table of Contents Table of
Deep River-Portage Burns Waterway Watershed 2015
 2.4 Soils Soil development is the product of the interaction of parent material, topography, climate, organisms and time. Understanding the types of soils that exist within a watershed and their characteristics
INITIAL RUN-ON AND RUN-OFF CONTROL PLAN 40 C.F.R. PART 257
 INITIAL RUN-ON AND RUN-OFF CONTROL PLAN 40 C.F.R. PART 257.81 HUFFAKER ROAD (PLANT HAMMOND) PRIVATE INDUSTRIAL LANDFILL (HUFFAKER ROAD LANDFILL) GEORGIA POWER COMPANY EPA s Disposal of Coal Combustion
Stormwater Erosion Control & Post-Construction Plans (Stormwater Quality Plans)
") Stormwater Erosion Control & Post-Construction Plans (Stormwater Quality Plans) Allen County Stormwater Plan Submittal Checklist The following items must be provided when applying for an Allen County Stormwater
Stormwater Erosion Control & Post-Construction Plans (Stormwater Quality Plans) Allen County Stormwater Plan Submittal Checklist The following items must be provided when applying for an Allen County Stormwater
Stormwater Review Part 2. Rainfall and Runoff. Tom Seybert, PE and Andy Bennett, PE. Pennsylvania Surveyors Conference 2019
 Stormwater Review Part 2 Rainfall and Runoff Tom Seybert, PE and Andy Bennett, PE Pennsylvania Surveyors Conference 2019 1 Topics Covered 1. Rainfall characteristics and sources 2. Watershed characteristics
Storm Water Management Design Manual Georgetown County, South Carolina
 Storm Water Management Design Manual Georgetown County, South Carolina November 14, 2006 Storm Water Management Design Manual Table of Contents TABLE OF CONTENTS SECTION PAGE 1.0 Design Specifications...1-1
Appendix I OFFICE OF THE MORGAN COUNTY SURVEYOR STORMWATER DESIGN MANUAL 7/1/2008
 Appendix I OFFICE OF THE MORGAN COUNTY SURVEYOR This Page Left Intentionally Blank OFFICE OF THE MORGAN COUNTY SURVEYOR APPENDIX I PAGE 1 Appendix II OFFICE OF THE MORGAN COUNTY SURVEYOR This Page Left
PRELIMINARY DRAINAGE REPORT FOR THE EDI MASTER PLAN
 PRELIMINARY DRAINAGE REPORT FOR THE EDI MASTER PLAN April 5, 2015 Wayne W. Chang, MS, PE 46548 Chang Civil Engineering Hydrology Hydraulics Sedimentation P.O. Box 9496 Rancho Santa Fe, CA 92067 (858) 692-0760
Run-on and Run-off Control System Plan
 Run-on and Run-off Control System Plan For Compliance with the Coal Combustion Residuals Rule (40 CFR 257.81) Pawnee Station CCR Landfill Public Service Company of Colorado Denver, Colorado October 17,
APPENDIX E APPENDIX E ESTIMATING RUNOFF FOR SMALL WATERSHEDS
 APPENDIX E ESTIMATING RUNOFF FOR SMALL WATERSHEDS March 18, 2003 This page left blank intentionally. March 18, 2003 TABLES Table E.1 Table E.2 Return Frequencies for Roadway Drainage Design Rational Method
Written by: Lindsay O Leary Date: 11 /08 /26 Reviewed by: Brandon Klenzendorf Date: 11 /08 /26 YY MM DD YY MM DD
 Page 2 of 21 Written by: Lindsay O Leary Date: 11 /08 /26 Reviewed by: Brandon Klenzendorf Date: 11 /08 /26 YY MM DD YY MM DD Client: Malcolm Pirnie, Inc. Project: ASARCO El Paso Site Project/Proposal
SECTION III: WATERSHED TECHNICAL ANALYSIS
 Trout Creek Watershed Stormwater Management Plan SECTION III: WATERSHED TECHNICAL ANALYSIS A. Watershed Modeling An initial step this study of the Trout Creek watershed was the selection of a stormwater
Faculty of Applied Science and Engineering. Department of Civil Engineering. Hydrology and Hydraulics. Final Exam, April 21, 2017
 F Name: Student #: University of Toronto Faculty of Applied Science and Engineering Department of Civil Engineering C1V250 - Hydrology and Hydraulics Final Exam, April 21, 2017 Duration: 2 and V2 hrs The
Chapter 6. Hydrology. 6.0 Introduction. 6.1 Design Rainfall
 6.0 Introduction This chapter summarizes methodology for determining rainfall and runoff information for the design of stormwater management facilities in the City. The methodology is based on the procedures
CHELTENHAM TOWNSHIP Chapter 290: WATERSHED STORMWATER MANAGEMENT Article IV: Stormwater Management
 CHELTENHAM TOWNSHIP Chapter 290: WATERSHED STORMWATER MANAGEMENT Article IV: Stormwater Management Online ECode Available on Cheltenham Township Website at: http://ecode360.com/14477578 For all regulated
ORDINANCE APPENDIX C RUNOFF COEFFICIENTS AND CURVE NUMBERS
 ORDINANCE APPENDIX C RUNOFF COEFFICIENTS AND CURVE NUMBERS TABLE C-1. RUNOFF CURVE NUMBERS Source: Table 2-2a, Table 2-2b, and Table 2-2c from U. S. Department of Agriculture, Natural Resources Conservation
Section 600 Runoff Table of Contents
 Section 600 Runoff Table of Contents 601 INTRODUCTION...600-1 602 RATIONAL METHOD...600-1 602.1 Rational Method Formula...600-2 602.2 Time of Concentration...600-2 602.3 Intensity...600-4 602.4 Runoff
DRAINAGE & DESIGN OF DRAINAGE SYSTEM
 Drainage on Highways DRAINAGE & DESIGN OF DRAINAGE SYSTEM P. R.D. Fernando Chartered Engineer B.Sc.(Hons), M.Eng. C.Eng., MIE(SL) Drainage Requirement of Highway Drainage System Introduction Drainage means
Standards for Soil Erosion and Sediment Control in New Jersey May 2012 STANDARD FOR GRASSED WATERWAYS. Definition. Purpose
 STANDARD FOR GRASSED WATERWAYS Definition A natural or constructed watercourse shaped or graded in earth materials and stabilized with suitable vegetation for the safe conveyance of runoff water. Purpose
Site Design Checklist and LID Calculations Worksheet. Draft Revision December 2004
 Site Design Checklist and LID Calculations Worksheet Draft Revision December 2004 Introduction Conventional stormwater management seeks to attenuate flood peaks and treat for stormwater pollutants such
Activity Calculating Property Drainage
 Page 1 of 5 Activity 2.3.11 Calculating Property Drainage Introduction When a property is developed, it is important to understand that changes to watershed characteristics (i.e., land use, slope, soil
City Plaza Residential (TPM ) Preliminary Hydrology Report
 Preliminary Hydrology Report") Hydrology Study City Plaza Residential (TPM 2016-127) Preliminary Hydrology Report Orange, Orange County, California Prepared For: Greenlaw Partners 18301 Von Karman Avenue, Suite 250 Irvine, CA 92612
Hydrology Study City Plaza Residential (TPM 2016-127) Preliminary Hydrology Report Orange, Orange County, California Prepared For: Greenlaw Partners 18301 Von Karman Avenue, Suite 250 Irvine, CA 92612
APPENDIX E ESTIMATING RUNOFF FROM SMALL WATERSHEDS
 ESTIMATING RUNOFF FROM SMALL WATERSHEDS June 2011 THIS PAGE LEFT BLANK INTENTIONALLY. June 2011 TABLES Table E.1 Table E.2 Return Frequencies for Roadway Drainage Design Rational Method Values June 2011
Learning objectives. Upon successful completion of this lecture, the participants will be able to describe:
 Solomon Seyoum Learning objectives Upon successful completion of this lecture, the participants will be able to describe: The different approaches for estimating peak runoff for urban drainage network
Particulate Transport in Grass Swales
 Particulate Transport in Grass Swales Robert Pitt, P.E., Ph.D., DEE and S. Rocky Durrans, P.E., Ph.D. Department of Civil, Construction, and Environmental Engineering The University of Alabama Yukio Nara
RUNOFF CALCULATIONS RATIONAL METHOD. To estimate the magnitude of a flood peak the following alternative methods are available:
 RUNOFF CALCULATIONS To estimate the magnitude of a flood peak the following alternative methods are available: 1. Unit-hydrograph technique 2. Empirical method 3. Semi-Empirical method (such rational method).
A Hydrologic Study of the. Ryerson Creek Watershed
 A Hydrologic Study of the Ryerson Creek Watershed Dave Fongers Hydrologic Studies Unit Land and Water Management Division Michigan Department of Environmental Quality May 8, 2002 Table of Contents Summary...2
Contents. Drainage Analysis: Hunters Trace, Westpointe, and Hunters Creek
 Drainage Analysis: Hunters Trace, Westpointe, and Hunters Creek Contents SITE LOCATION / DESCRIPTION... 3 WESTPOINTE STORMWATER MANAGEMENT PLAN... 3 THE ENCLAVE AT WESTPOINTE DETENTION POND... 3 Table
Land Development and Soil Characteristics Affects on Runoff
 Land Development and Soil Characteristics Affects on Runoff Robert Pitt, Celina Bochis, and Pauline Johnson Department of Civil, Construction and Environmental Engineering The University of Alabama Tuscaloosa,
CUYAHOGA COUNTY ENGINEER
 CUYAHOGA COUNTY ENGINEER DRAINAGE MANUAL Supplement to O.D.O.T. LOCATION and DESIGN MANUAL, Volume 2, Drainage Design, Section 1000 and 1100 May 28, 2010 Revisions to the July 29, 2009 edition are noted
RUN-ON AND RUN-OFF CONTROL PLAN 40 C.F.R. PART PLANT DANIEL NORTH ASH MANAGEMENT UNIT MISSISSIPPI POWER COMPANY
 RUN-ON AND RUN-OFF CONTROL PLAN 40 C.F.R. PART 257.81 PLANT DANIEL NORTH ASH MANAGEMENT UNIT MISSISSIPPI POWER COMPANY EPA s Disposal of Coal Combustion Residuals from Electric Utilities Final Rule (40
Chapter 2: Conditions in the Spring Lake Watershed related to Stormwater Pollution
 Chapter 2: Conditions in the Spring Lake Watershed related to Stormwater Pollution To identify the primary causes and consequences of stormwater discharges to Spring Lake and its adjoining waterbodies,
Appendix C.1. Design Example 1 Shallow Wetland (W-1)
") Appendix C.1 Design Example 1 Shallow Wetland (W-1) Design Example 1 Shallow Wetland (W-1) The following example demonstrates the process for the design of a shallow wetland (W-1) BMP. Site Specific Data
Appendix C.1 Design Example 1 Shallow Wetland (W-1) Design Example 1 Shallow Wetland (W-1) The following example demonstrates the process for the design of a shallow wetland (W-1) BMP. Site Specific Data
A Comparison of Runoff Estimation Techniques
 A Comparison of Runoff Estimation Techniques by David E. Fantina, PE Introduction: This course presents an overview of and comparison of different methodologies for computing stormwater runoff. As explained
Table of Contents. Overview... 1
 Chapter 3 Chapter 3 Table of Contents Overview... 1 Rainfall... 2 3-2-1 Rainfall Depths and Intensities... 2 3-2-2 Design Storm Distribution for Colorado Urban Hydrograph Procedure (CUHP)... 5 3-2-3 Temporal
Stormwater Quality Review Checklist - General
 Stormwater Quality Review Checklist - General General 1) Map of proposed subwatershed to each subbasin provided, including total area and CN 2) Drainage areas match topography 3) Drainage area estimates
Effect of Land Surface on Runoff Generation
 Effect of Land Surface on Runoff Generation Context: Hydrologic Cycle Runoff vs Infiltration Infiltration: Process by which water on the ground surface enters the soil Runoff: Water (from rain, snowmelt,
Design Example Residential Subdivision
 Design Example Residential Subdivision Rhode Island Stormwater Design and Installation Standards Manual December 2010 Public Training March 22, 2010 Richard Claytor, P.E. 508-833-6600 Appendix D: Site
ENGN.4010 ENGINEERING CAPSTONE DESIGN Watershed Analysis. CiA
 RATIONAL METHOD Q CiA Where: Q = Maximum Rate of Runoff (cfs) C = Runoff Coefficient i = Average Rainfall Intensity (in/hr) A = Drainage Area (in acres) RATIONAL METHOD Assumptions and Limitations: Watershed
Learn how to design inlet grates, detention basins, channels, and riprap using the FHWA Hydraulic Toolbox and WMS
 v. 11.0 WMS 11.0 Tutorial Learn how to design inlet grates, detention basins, channels, and riprap using the FHWA Hydraulic Toolbox and WMS Objectives Learn how to use several Hydraulic Toolbox calculators
Culvert Sizing procedures for the 100-Year Peak Flow
 CULVERT SIZING PROCEDURES FOR THE 100-YEAR PEAK FLOW 343 APPENDIX A: Culvert Sizing procedures for the 100-Year Peak Flow A. INTRODUCTION Several methods have been developed for estimating the peak flood
16.0 Water Quality Management Criteria for Developed Land
 October 2003, Revised February 2005 Criteria for Developed Land Page 1 16.1 Introduction 16.0 Water Quality Management Criteria for Developed Land Stormwater quality control is an integral part of any
INFLOW DESIGN FLOOD CONTROL SYSTEM PLAN PLANT GREENE COUNTY ASH POND ALABMA POWER COMPANY
 INFLOW DESIGN FLOOD CONTROL SYSTEM PLAN PLANT GREENE COUNTY ASH POND ALABMA POWER COMPANY Section 257.82 of EPA s regulations requires the owner or operator of an existing or new CCR surface impoundment
Jacobi, Toombs, and Lanz, Inc.
 Area 5: Blackiston Mill Road at Dead Man's Hollow Flooding Assessment Jacobi, Toombs, and Lanz, Inc. This document summarizes an assessment of drainage and flooding concerns and provides recommendations
ATTACHMENT 6 WATER QUALITY SWALE DESIGN ADDENDUM
 ATTACHMENT 6 WATER QUALITY SWALE DESIGN ADDENDUM 12 October 2010 Project No. 073-81694.0022 Mr. Robert R. Monok Project Manager Energy Fuels Resource Corporation 44 Union Boulevard, Suite 600 Lakewood,
Treatment Volume: Curve Numbers. Composite CN or Not? Treatment Volume: Curve Numbers. Treatment Volume: Calculation. Treatment Volume: Calculation
 Stormwater Engineering Bioretention Design Bill Hunt, PE, Ph.D. Extension Specialist & Assistant Professor NCSU-BAE www.bae.ncsu.edu/stormwater Bioretention Design Six Step Process 1 Determine Volume to
Standards for Soil Erosion and Sediment Control in New Jersey May 2012 STANDARD FOR SLOPE PROTECTION STRUCTURES. Definition
 STANDARD FOR SLOPE PROTECTION STRUCTURES Definition Structures to safely conduct surface runoff from the top of a slope to the bottom of the slope. Purpose The purpose of this practice is to convey storm
At least 2 feet above the seasonal high water table Overflow path or structure provided
 General Conditions Map of proposed subwatershed to each subbasin, including total area and CN Design Flow or Design Volume to each STF, as appropriate Operation and Maintenance instructions for each STF
Public Notice U.S. Army Corps of Engineers, Norfolk District
 Public Notice U.S. Army Corps of Engineers, Norfolk District CENAO-REG August 29, 2007 Federal Public Notice Requirement Relative to Low Impact Development On July 22, 2004, August 10, 2006, and February
INITIAL INFLOW DESIGN FLOOD CONTROL SYSTEM PLAN PLANT MCMANUS ASH POND A (AP-1) 40 CFR
 40 CFR") INITIAL INFLOW DESIGN FLOOD CONTROL SYSTEM PLAN PLANT MCMANUS ASH POND A (AP-1) 40 CFR 257.82 EPA s Disposal of Coal Combustion Residuals from Electric Utilities Final Rule (40 C.F.R. Part 257 and Part
INITIAL INFLOW DESIGN FLOOD CONTROL SYSTEM PLAN PLANT MCMANUS ASH POND A (AP-1) 40 CFR 257.82 EPA s Disposal of Coal Combustion Residuals from Electric Utilities Final Rule (40 C.F.R. Part 257 and Part
WMS Tools For Computing Hydrologic Modeling Parameters
 WMS Tools For Computing Hydrologic Modeling Parameters Lesson 9 9-1 Objectives Use the drainage coverage as a basis for geometric parameters as well as overlaying coverages to compute important hydrologic
Project Drainage Report
 Design Manual Chapter 2 - Stormwater 2A - General Information 2A-4 Project Drainage Report A. Purpose The purpose of the project drainage report is to identify and propose specific solutions to stormwater
AED Design Requirements: Hydrology Studies (Provisional)
") US Army Corps of Engineers Afghanistan Engineer District AED Design Requirements: Hydrology Studies (Provisional) Various Locations, Afghanistan January 2010, Version 1.6 TABLE OF CONTENTS AED DESIGN REQUIREMENTS
US Army Corps of Engineers Afghanistan Engineer District AED Design Requirements: Hydrology Studies (Provisional) Various Locations, Afghanistan January 2010, Version 1.6 TABLE OF CONTENTS AED DESIGN REQUIREMENTS