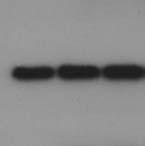
a KYSE270-CON KYSE270-Id1
|
|
|
- Reynold Nathan Bryant
- 5 years ago
- Views:
Transcription
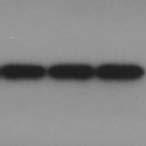
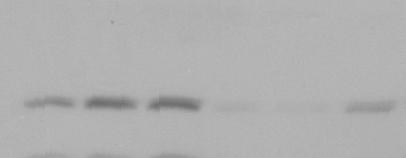
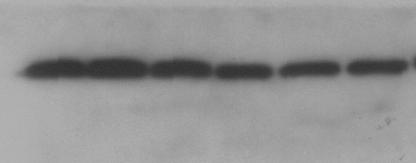
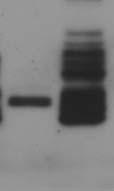
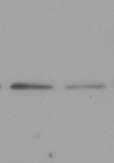
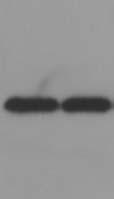
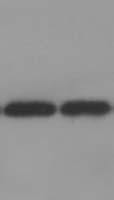
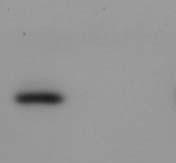
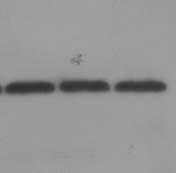
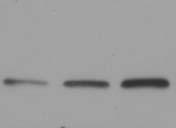
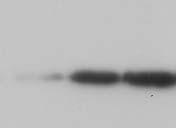
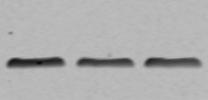
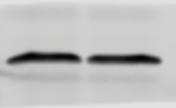
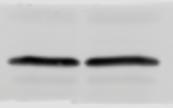
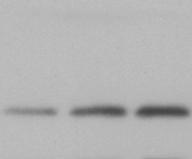
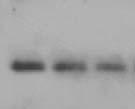
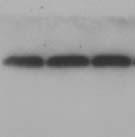
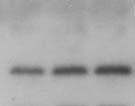
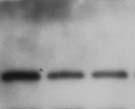
1 a KYSE27-CON KYSE27- shcon shcon sh b Human Mouse CD31 Relative MVD *** *** c KYSE15 KYSE27 sirna (nm) 5 1 Id2 Id2 sirna 5 1 sirna (nm) 5 1 Id2 sirna 5 1 Id2 [h] (pg per ml) d KYSE27- KYSE27- CON-shCON -shcon Fibronec n DAPI Merged (Fibronec n + DAPI) E-cadherin KYSE27- CON-shCON KYSE27- -shcon KYSE27- -sh KYSE27- -sh [m] (pg per ml) *** ** KYSE27- KYSE27- CON-shCON -shcon KYSE27 KYSE27- -sh Id3 Id3 sirna 5 1 Id3 Id3 sirna 5 1 DAPI e g Relative proliferation Id4 CM from PIGF FGF Control Id4 sirna 5 1 CON Id4 Relative proliferation Id4 sirna 5 1 CON Proliferation of fibroblasts Control Merged (E-cadherin + DAPI) f Relative proliferation CM from h Proliferation of fibroblasts Relative proliferation CM from (ng per ml) p-akt -7-7 AKT -1-1 p-mdm2 p Supplementary Figure 1. -induced secreted from ESCC cells increases -mediated tumor angiogenesis but had no effect on fibroblast proliferation. (a) Quantification of CD31-MVD in the tumors established with KYSE27-, KYSE27--sh or vector control (female 6-8 week old nude mice, n = 3 per group; scale bar, 1 µm). (b) Human and mouse concentrations were determined in the serum of mice bearing xenografts expressing KYS27--shCON, KYSE27--sh or vector control (female 6-8 week old nude mice, n = 3). (c) Western blots showing the effects of, Id2, Id3 and Id4 knockdown on by using sirnas. (d) Immunofluorescence showed positive staining for fibronectin but not E-cadherin in fibroblasts compared with ESCC cells (i.e. KYSE27). Cell nuclei were counterstained with DAPI (scale bar, 1 µm). (e) Western blot showing the effects of CM from -overexpressing ESCC cells on PIGF, FGF and. (f) MTT assay showed no significant difference in proliferation of fribroblasts fed with the indicated CM from ESCC cells over a 24 hour-period. (g) The proliferation of fibroblasts treated with (1 ng per ml) for 24 hours was quantified. (h) Western blot analysis showing the expression of p-akt, AKT, p-mdm2, p53 and in fibroblasts upon treatment. Three biological replicates were performed for in vitro assays. Bars, s.d.; **, P <.1; ***, P <.1 by Student s t-test.


.")
.")
2 a Relative proliferation Ab ** * CM b Ab Ab HUVEC migration CM CM Relative proliferation Ab ** * CM Relative migration Ab ** ** CM Relative migration Ab ** ** CM c Tube formation d Cancer cell invasion Ab CM Ab CM KYSE27 Ab CM Ab CM KYSE27 Relative tube formation 3 *** *** CM Ab Relative tube formation Ab *** *** CM Relative invasion KYSE27 3 ** * Ab CM Relative invasion Ab KYSE27 ** ** CM Supplementary Figure 2. Paracrine effects of -activated fibroblasts on and ESCC cells. (a) Cell proliferation of fed with CM from -induced fibroblasts in the presence or absence of antibody was determined by MTT assay. (b) Comparison of chemotactic effect of different CM from fibroblasts as indicated on the migration of (scale bar, 1 µm). (c) Representative images and quantification of tube formation of treated with different CM from fibroblasts as indicated (scale bar,1 µm). (d) Comparison of invasion of ESCC cells under chemotactic influence of different CM from fibroblasts (scale bar, 1 µm). Three biological replicates were performed for in vitro assays. Bars, s.d.; *, P <.5; **, P <.1; ***, P <.1 by Student s t-test.
3 a HUVEC migration Blank CM from co-culture of fibroblasts with ESCC cells KYSE15- CON-shCON KYSE15- -shcon KYSE15- -sh KYSE15- -shcon + Ab Relative migration ** ** ** * *** 5 *** ****** Relative migration CM from co-culture of fibroblasts with CM from co-culture of fibroblasts with b Blank KYSE15- CON-shCON Tube formation CM from co-culture of fibroblasts with ESCC cells KYSE15- -shcon KYSE15- -sh KYSE15- -shcon + Ab Relative tube formation CM from co-culture of fibroblasts with *** ** ** *** Relative tube formation CM from co-culture of fibroblasts with *** *** *** ** Supplementary Figure 3. Effects of fibroblasts co-cultured with ESCC cells on migration and tube-forming capability of. (a) CM from co-culture of fibroblasts and -overexpressing ESCC cells had the highest propensity to induce migration of, compared with ESCC cells expressing -sh or vector control (scale bar, 1 µm). (b) Treatment with CM from co-culture of fibroblasts and -overexpressing ESCC cells significantly increased the tube-formation activity of (scale bar, 1 µm). Three biological replicates were performed for in vitro assays. Bars, s.d.; *P, <.5; **P, <.1; ***P, <.1 by Student s t-test.
4 a in fibroblasts n = 22 r =.35 P = in ESCC tissue b Breast cancer Stromal Low Stromal High P =.22 n = 53 Months Stromal Recurrence No Yes Total Low High Total P =.5 Supplementary Figure 4. Correlation analysis of in ESCC and fibroblast and clinical relevance of stromal in breast cancer. (a) Graph correlating expression of in esophageal tissue with that of in fibroblasts. Correlation was assessed using Pearson s rank correlation coefficient. (b) The association between tumor stromal expression and the survival rates of patients with breast cancer in GEO database (GSE 914) was analyzed by Kaplan-Meier analysis; statistical significance was calculated by log-rank test; the Table below showed that the expression of stromal was significantly correlated with recurrence (P =.5 by Fisher exact test).


.")
5 a Bone marrow of nude mice with established s.c. tumor CON-shCON -shcon -sh ESCC tumor xenograft CON-shCON -shcon -sh + R1 R1+ GFP+ GFP+ Lung of nude mice with established s.c. tumor CON-shCON -shcon -sh + R1 GFP+ b Mice bearing xenografts of CD11B+ Mice bearing xenografts of F4/8+ CD11b 15 CON-shCON -shcon -sh 1 5 GFP+ GFP+ CON -sh F4/8 CON-shCON -shcon -sh GFP +/ CD11b + cells GFP +/ F4/8 + cells GFP+ CON -sh Mice bearing xenografts of CD335+ CD335 CON-shCON -shcon -sh GFP+ GFP +/ CD335 + cells CON -sh Mice bearing xenografts of R2+ R2 CON-shCON -shcon -sh GFP+ GFP +/ R2 + cells CON -sh Mice bearing xenografts of Gr-1 CON -sh 2 Gr-1+ GFP +/ Gr-1 + cells GFP + CON -sh Mice bearing xenografts of Tie-2+ Tie-2 CON -sh GFP +/ Tie-2 + cells GFP + CON -sh Supplementary Figure 5. Flow cytometric analysis of GFP + cells in bone marrow and lungs of nude mice bearing ESCC tumor xenografts. (a) GFP + /R1 + cell populations in the bone marrow, lungs and tumor of groups of mice with subcutaneous xenograft of ESCC cells expressing, -sh or control vectors (female 6-8 week old nude mice, n = 3 per group). (b) No significant difference was found in bone marrow CD11b +, F4/8 +, CD335 +, R2 +, Gr-1 + and Tie-2 + cell populations among the three groups (female 6-8 week old nude mice, n = 3 per group).
6 a Unsorted BM cells R1 - BM cells R1 + BM cells b Proliferation of R1 + BM cells 2.5%.32 % 95.1 % Relative proliferation CM from fibroblasts treated with: * * Blank + Ab c Relative migration CM from co-culture of fibroblasts with: Migration of R1 + BM cells *** *** *** ** Supplementary Figure 6. Paracrine effects of IGF-activated fibroblasts on migration and proliferation of R1 + bone marrow cells. (a) Post-sort analysis of R1 + bone marrow cells. (b) Comparison of proliferation of sorted R1 + bone marrow cells treated with the CM from -induced fibroblasts, in the presence or absence of antibody. (c) The migration of R1 + BMDCs attracted by different CM as indicated was determined. Three biological replicates were performed for in vitro assays. Bars, s.d.; *, P <.5; **, P <.1; ***, P <.1 by Student s t-test.

7 Tumor Mice bearing xenograft of KYSE15-CON -shcon KYSE15- -shcon KYSE15- -sh Treatment Isotype IgG Isotype IgG MF-1 Isotype IgG 35 Tumor 3 R1 cells ** * ** 5 CON -shcon -shcon -shcon + MF-1 -sh Supplementary Figure 7. Flow cytometric analysis showing the effects of MF-1 treatment and - knockdown on reducing the expression of R1 + cells in the tumor of mice bearing - overexpressing tumor xenografts (female 6-8 week old nude mice, n = 3 per group)..


8 CXCL5 in Lung Mice bearing xenograft of CON -sh Supplementary Figure 8. Immunohistochemical detection of CXCL5 in the lung tissue of mice bearing indicated tumor xenografts. Scale bar, 2 µm.
 5 1 5 1")


9 Fig. 1c Fig. 1e (ng/ml) α-sma α-sma α-sma α-sma Fig. 2a Fig. 3c N T N T N T N T N T N T N T N T N T N T N T - 25 kd mir-127-5p mir-29c NEF CAF NEF CAF NEF CAF NEF CAF NEF CAF NEF CAF NEF CAF NEF CAF NEF CAF NEF CAF NEF CAF α-sma Supplementary Figure 9. Full blots of indicated figures.


10 Fig. 3d Fig. 3f mir-29c mir-29c Mimic (nm) mir-29c Inhibitor (nm) Fig. 4c p53 p53 Supplementary Figure 1. Full blots of indicated figures.
 P53")


 5 1 5 1 5")


11 Fig. 4f Fig. 4g (ng/ml) P53 -/- MEF 5 1 p53 p53 p53 Supplementary Fig.1c KYSE15 sirna Id2 sirna Id3 sirna Id4 sirna sirna (Nm) kd - 15 kd Id2-15 kd Id4 Id3-1 kd - 1 kd -1 kd - 15 kd - 25 kd - 25 kd KYSE27 sirna Id2 sirna Id3 sirna Id4 sirna sirna (Nm) kd - 25 kd Id2 Id3 Id4-25 kd - 25 kd - 15 kd - 15 kd - 15 kd Supplementary Figure 11. Full blots of indicated figures.

12 Supplementary Fig. 1e Supplementary Fig. 1h CM from PIGF CON PIGF CON (ng/ml) p-akt kd p-akt kd - 15 kd AKT -7 kd AKT -7 kd FGF - 1 kd FGF -1 kd - 25 kd p-mdm2 p53-1 kd - 7 kd p-mdm2 p53-1 kd -7 kd Supplementary Figure 12. Full blots of indicated figures.
13 Supplementary Table 1. Correlation between / expression levels and clinicopathological parameters in patients with ESCC. Variable n Low / Low High / High P value a Age (years) Gender Female Male Histological grade Poorly differentiated Moderately/well differentiated T-Stage 1/ / N-Stage N N M-Stage M M Pathologic stage Stages I & II Stages III & IV a Fisher s exact test. Statistical significance (P <.5) is shown in bold.
14 Supplementary Table 2. Cox proportional hazard regression analyses for overall survival. Clinical features Univariate analysis Multivariate analysis HR (95 % CI) P value HR (95 % CI) P value Age 1.13 ( ) Gender 1.211( ) Differentiation 1.453( ) pt stage 2.342( ) pn stage 1.748( ) pm stage 3.455( ) Pathological stage 2.476( ) ( ).4 / expression ( ) ( ).26 HR Hazard ratio, CI Confidence interval Statistical significance (P <.5) is shown in bold.
15 Supplementary Table 3. Primers used in RT-PCR for 4 putative mirnas that bind with 3 UTR of. mirnas mir15a-5p mir29c mir13a mir125a-3p mir125a-5p mir127-5p mir134-5p mir14-5p mir185-5p mir186-5p mir199a-5p mir2b mir25-5p mir299 mir3 mir329 mir33-3p mir331-3p mir339-5p mir361-5p mir374a mir383-5p mir41 mir495 mir53-5p mir516a-3p mir593 mir874 mir939-5p mir365 mir3668 mir398 mir427 mir4279 mir4455 mir4481 mir4524a-5p mir4731-5p mir4742-3p mir4782-5p Primer sequence CTAGCAGCACATAATGGTTTGTGA GCTAGCACCATTTGAAATCGGTTA GCAGCATTGTACAGGGCTATGA GTGAGGTTCTTGGGAGCCA CCCTGAGACCCTTTAACCTGTGA CTGAAGCTCAGAGGGCTCTGAT GACTGGTTGACCAGAGGGGA GCCAGTGGTTTTACCCTATGGTAG GGAGAGAAAGGCAGTTCCTGAA CAAAGAATTCTCCTTTTGGGCT AGTGTTCAGACTACCTGTTCA AATACTGCCTGGTAATGATGAA CTTCATTCCACCGGAGTCTGA TATGTGGGATGGTAAACCGCTT GCCTATACAAGGGCAGACTCTCTCT GCAACACACCTGGTTAACCTCTTT GCACACGGCCTGCAGAGA CCCTGGGCCTATCCTAGAA GTCCTCCAGGAGCTCACG GCTTATCAGAATCTCCAGGGGTAC TTATAATACAACCTGATAAGTGAA GAGATCAGAAGGTGATTGTGGCT GCGAATATAACACAGATGGCCTGTA AACAAACATGGTGCACTTCTTA AGCGGGAACAGTTCTGCAG TGCTTCCTTTCAGAGGGTAAA GCTGTCTCTGCTGGGGTTTCT TGGCCCGAGGGACCGA GCTGAGGCTCTGGGGGTG CGCAGGTGTGTCTGTAGAGTCC GCGCAATGTAGAGATTGATCAAAAT GCGAGCAATGTAGGTAGACTGTTT AGGGAGTCAGGGGAGGGC GCTCTCCTCCCGGCTTC CGCAGGGTGTGTGTGTTTTT CGGAGTGGGCTGGTGGTTA GATAGCAGCATGAACCTGTCTCA GGGGGCCACATGAGTGTG TCTGTATTCTCCTTTGCCTGCAG GCCTTCTGGATATGAAGACAATCAA
16 Supplementary Table 4. Primer sequences used for testing p53 mutation. Exon Primer Sequence (5-3 ) exon1 Forward CACAGCTCTGGCTTGCAGA Reverse AGCGATTTTCCCGAGCTGA exon2 Forward AGCTGTCTCAGACACTGGCA Reverse GAGCAGAAAGTCAGTCCCATG exon3-4 Forward AGACCTATGGAAACTGTGAGTGGA Reverse GAAGCCTAAGGGTGAAGAGGA exon5-6 Forward CGCTAGTGGGTTGCAGGA Reverse CACTGACAACCACCCTTAAC exon7 Forward CTGCTTGCCACAGGTCTC Reverse TGGATGGGTAGTAGTATGGAAG exon8-9 Forward GTTGGGAGTAGATGGAGCCT Reverse GGCATTTTGAGTGTTAGACTG exon1 Forward CTCAGGTACTGTGTATATACTTAC Reverse ATACTACGTGGAGGCAAGAAT exon11 Forward TCCCGTTGTCCCAGCCTT Reverse TAACCCTTAACTGCAAGAACAT
17 Supplementary Table 5. Primers used for generating pgl3-mir29c promoter mutations. Primer BS1-F BS1-R BS2-F BS2-R BS3-F BS3-R Sequence 5'-tcactcccttaccttccacataagaacagctcggacagacagat-3' 5'-atctgtctgtccgagctgttcttatgtggaaggtaagggagtga-3' 5'-gccctgtactaaatgttgcatcttgatttcttgagccatatgggct-3' 5'-agcccatatggctcaagaaatcaagatgcaacatttagtacagggc-3' 5'-tggccttgatggcactaaagaatgacccccagaaaggtcc-3' 5'-ggacctttctgggggtcattctttagtgccatcaaggcca-3'
18 Supplementary Table 6. Primer sequences used in ChIP-qPCR assay. Primer ChIP-BS1-F ChIP-BS1-R ChIP-BS2-F ChIP-BS2-R ChIP-BS3-F ChIP-BS3-R Sequence 5'-tgtcttcctttcggcacttc -3' 5'-tccaagttgtttgggtgtca -3' 5'-gggctgccctgtactaaatg -3' 5'-gtggtcagggtgaggaacat -3' 5'-ggttgagcatgccaataaaga -3' 5'-ggcaaatgggatttaagtaaccaga -3'
Supplementary Figure 1. Reconstitution of human-acquired lymphoid system in
 Supplementary Figure 1. Reconstitution of human-acquired lymphoid system in mouse NOD/SCID/Jak3 null mice were transplanted with human CD34 + hematopoietic stem cells. (Top) Four weeks after the transplantation
TE5 KYSE510 TE7 KYSE70 KYSE140
 TE5 KYSE5 TT KYSE7 KYSE4 Supplementary Figure. Hockey stick plots showing input normalized, rank ordered H3K7ac signals for the candidate SE-associated lncrnas in this study. Rpm Rpm Rpm Chip-seq H3K7ac
Supplementary Fig. 1 related to Fig. 1 Clinical relevance of lncrna candidate
 Supplementary Figure Legends Supplementary Fig. 1 related to Fig. 1 Clinical relevance of lncrna candidate BC041951 in gastric cancer. (A) The flow chart for selected candidate lncrnas in 660 up-regulated
monoclonal antibody. (a) The specificity of the anti-rhbdd1 monoclonal antibody was examined in
 The specificity of the anti-rhbdd1 monoclonal antibody was examined in") Supplementary information Supplementary figures Supplementary Figure 1 Determination of the s pecificity of in-house anti-rhbdd1 mouse monoclonal antibody. (a) The specificity of the anti-rhbdd1 monoclonal
Supplementary information Supplementary figures Supplementary Figure 1 Determination of the s pecificity of in-house anti-rhbdd1 mouse monoclonal antibody. (a) The specificity of the anti-rhbdd1 monoclonal
Cell proliferation was measured with Cell Counting Kit-8 (Dojindo Laboratories, Kumamoto, Japan).
.") 1 2 3 4 5 6 7 8 Supplemental Materials and Methods Cell proliferation assay Cell proliferation was measured with Cell Counting Kit-8 (Dojindo Laboratories, Kumamoto, Japan). GCs were plated at 96-well
1 2 3 4 5 6 7 8 Supplemental Materials and Methods Cell proliferation assay Cell proliferation was measured with Cell Counting Kit-8 (Dojindo Laboratories, Kumamoto, Japan). GCs were plated at 96-well
supplementary information
 Figure S1 ZEB1 full length mrna. (a) Analysis of the ZEB1 mrna using the UCSC genome browser (http://genome.ucsc.edu) revealed truncation of the annotated Refseq sequence (NM_030751). The probable terminus
Supplementary Fig. 1. Multiple five micron sections of liver tissues of rats treated
 Supplementary Figure Legends Supplementary Fig. 1. Multiple five micron sections of liver tissues of rats treated with either vehicle (left; n=3) or CCl 4 (right; n=3) were co-immunostained for NRP-1 (green)
MLN8237 induces proliferation arrest, expression of differentiation markers and
 Supplementary Figure Legends Supplementary Figure 1 827 induces proliferation arrest, expression of differentiation markers and polyploidization of a human erythroleukemia cell line with the activating
supplementary information
 DOI: 1.138/ncb1839 a b Control 1 2 3 Control 1 2 3 Fbw7 Smad3 1 2 3 4 1 2 3 4 c d IGF-1 IGF-1Rβ IGF-1Rβ-P Control / 1 2 3 4 Real-time RT-PCR Relative quantity (IGF-1/ mrna) 2 1 IGF-1 1 2 3 4 Control /
Supplementary Information
 Supplementary Information Supplementary Figures Supplementary Figure 1. MLK1-4 phosphorylate MEK in the presence of RAF inhibitors. (a) H157 cells were transiently transfected with Flag- or HA-tagged MLK1-4
Supplementary Figure 1, related to Figure 1. GAS5 is highly expressed in the cytoplasm of hescs, and positively correlates with pluripotency.
 Supplementary Figure 1, related to Figure 1. GAS5 is highly expressed in the cytoplasm of hescs, and positively correlates with pluripotency. (a) Transfection of different concentration of GAS5-overexpressing
Supplementary information
 Supplementary information Epigenetic silencing of retinoblastoma gene regulates pathologic differentiation of myeloid cells in cancer Je-In Youn, Vinit Kumar, Michelle Collazo, Yulia Nefedova, Thomas Condamine,
0.9 5 H M L E R -C tr l in T w is t1 C M
 a. b. c. d. e. f. g. h. 2.5 C elltiter-g lo A ssay 1.1 5 M T S a s s a y Lum inescence (A.U.) 2.0 1.5 1.0 0.5 n s H M L E R -C tr l in C tr l C M H M L E R -C tr l in S n a il1 C M A bsorbance (@ 490nm
SUPPLEMENTARY INFORMATION
 SUPPLEMENTARY INFORMATION Supplementary Figure 1. Detecting ESR1-CCDC170 and P2RY6-ARHGEF17 chimerical transcripts in breast cancer cell lines by RT-PCR. (a) RT-PCR results using a forward primer (AACAGGCTCGAAAGGTCCATGC)
Supplementary Materials for
 www.sciencesignaling.org/cgi/content/full/10/483/eaak9557/dc1 Supplementary Materials for The lncrna H19 mediates breast cancer cell plasticity during EMT and MET plasticity by differentially sponging
Utility of the dual-specificity protein kinase TTK as a therapeutic target
 Utility of the dual-specificity protein kinase TTK as a therapeutic target for intrahepatic spread of liver cancer Ruoyu Miao, 1,2* Yan Wu, 2* Haohai Zhang, 1 Huandi Zhou, 3 Xiaofeng Sun, 2 Eva Csizmadia,
Supplementary Figure 1. Characterization of EVs (a) Phase-contrast electron microscopy was used to visualize resuspended EV pellets.
 Phase-contrast electron microscopy was used to visualize resuspended EV pellets.") Supplementary Figure 1. Characterization of EVs (a) Phase-contrast electron microscopy was used to visualize resuspended EV pellets. Scale bar represent 100 nm. The sizes of EVs from MDA-MB-231-D3H1 (D3H1),
Supplementary Figure 1. Characterization of EVs (a) Phase-contrast electron microscopy was used to visualize resuspended EV pellets. Scale bar represent 100 nm. The sizes of EVs from MDA-MB-231-D3H1 (D3H1),
promote ROS production and metastasis of HCC cells
 MCU-dependent mitochondrial Ca 2+ inhibits NAD+/SIRT3/SOD2 pathway to promote ROS production and metastasis of HCC cells Tingting Ren 1#, Hui Zhang 2#, Jiaojiao Wang 1, Jianjun Zhu 1, Mingpeng Jin 1,Yousheng
Supplementary Materials for
 www.sciencesignaling.org/cgi/content/full/10/496/eaam6291/dc1 Supplementary Materials for Regulation of autophagy, NF-κB signaling, and cell viability by mir-124 in KRAS mutant mesenchymal-like NSCLC cells
Supplementary Figures
 Supplementary Figures Supplementary Figure 1. Description of the observed lymphatic metastases in two different SIX1-induced MCF7 metastasis models (Nude and NOD/SCID). Supplementary Figure 2. MCF7-SIX1
Nature Biotechnology: doi: /nbt Supplementary Figure 1
 Supplementary Figure 1 Generation of the AARE-Gene system construct. (a) Position and sequence alignment of AAREs extracted from human Trb3, Chop or Atf3 promoters. AARE core sequences are boxed in grey.
 Figure S1. Generation of HspA4 -/- mice. (A) Structures of the wild-type (Wt) HspA4 -/- allele, targeting vector and targeted allele are shown together with the relevant restriction sites. The filled rectangles
Supplementary Table 1. Sequences for BTG2 and BRCA1 sirnas.
 Supplementary Table 1. Sequences for BTG2 and BRCA1 sirnas. Target Gene Non-target / Control BTG2 BRCA1 NFE2L2 Target Sequence ON-TARGET plus Non-targeting sirna # 1 (Cat# D-001810-01-05) sirna1: GAACCGACAUGCUCCCGGA
Supplementary Materials
 Supplementary Materials Supplementary Figure 1. PKM2 interacts with MLC2 in cytokinesis. a, U87, U87/EGFRvIII, and HeLa cells in cytokinesis were immunostained with DAPI and an anti-pkm2 antibody. Thirty
SUPPLEMENTARY INFORMATION
 DOI: 10.1038/ncb3240 Supplementary Figure 1 GBM cell lines display similar levels of p100 to p52 processing but respond differentially to TWEAK-induced TERT expression according to TERT promoter mutation
Supplementary Figure 1. TSA (10 nmol/l), non-class-selective HDAC inhibitor, potentiates
, non-class-selective HDAC inhibitor, potentiates") Supplementary Figure 1. TSA (10 nmol/l), non-class-selective HDAC inhibitor, potentiates vascular calcification (VC). (a) Von Kossa staining shows that TSA potentiated the Pi-induced VC. Scale bar, 100
Supplementary Figure 1. TSA (10 nmol/l), non-class-selective HDAC inhibitor, potentiates vascular calcification (VC). (a) Von Kossa staining shows that TSA potentiated the Pi-induced VC. Scale bar, 100
Contribution and Mobilization of Mesenchymal Stem Cells in a mouse model of carbon tetrachloride-induced liver fibrosis
 Contribution and Mobilization of Mesenchymal Stem Cells in a mouse model of carbon tetrachloride-induced liver fibrosis Yan Liu 1,*, Zhipeng Han 1,*, Yingying Jing 1,*, Xue Yang 1, Shanshan Zhang 1, Chen
Supplementary Information
 Supplementary Information Supplementary Fig. 1 Morphology of NP69 and CNE1 cells. Phase contrast images of normal nasopharyngeal epithelial NP69 cells (left) and the well differentiated NPC CNE1 cells
Flowcytometry-based purity analysis of peritoneal macrophage culture.
 Liao et al., KLF4 regulates macrophage polarization Revision of Manuscript 45444-RG- Supplementary Figure Legends Figure S Flowcytometry-based purity analysis of peritoneal macrophage culture. Thioglycollate
FIG S1: Calibration curves of standards for HPLC detection of Dopachrome (Dopac), Dopamine (DA) and Homovanillic acid (HVA), showing area of peak vs
, Dopamine (DA) and Homovanillic acid (HVA), showing area of peak vs") FIG S1: Calibration curves of standards for HPLC detection of Dopachrome (Dopac), Dopamine (DA) and Homovanillic acid (HVA), showing area of peak vs amount of standard analysed. Each point represents the
FIG S1: Calibration curves of standards for HPLC detection of Dopachrome (Dopac), Dopamine (DA) and Homovanillic acid (HVA), showing area of peak vs amount of standard analysed. Each point represents the
(a) Scheme depicting the strategy used to generate the ko and conditional alleles. (b) RT-PCR for
 Scheme depicting the strategy used to generate the ko and conditional alleles. (b) RT-PCR for") Supplementary Figure 1 Generation of Diaph3 ko mice. (a) Scheme depicting the strategy used to generate the ko and conditional alleles. (b) RT-PCR for different regions of Diaph3 mrna from WT, heterozygote
Supplementary Figure 1 Generation of Diaph3 ko mice. (a) Scheme depicting the strategy used to generate the ko and conditional alleles. (b) RT-PCR for different regions of Diaph3 mrna from WT, heterozygote
HEAHKFLKVEFPARVRSSQATYEIQFGHLQRPTHYNTSWDWARFEVWAHRWMDLSEHGFG Sbjct: 805 HEAHKFLKVEFPARVRSSQATYEIQFGHLQRPTHYNTSWDWARFEVWAHRWMDLSEHGFG 864
 Supplementary Fig S1 a gi 27923805 sp Q9NTJ4 MAN2C1HUMAN Alpha-mannosidase 2C1 (Alpha-D-mannoside mannohydrolase) (Mannosidase alpha class 2C member 1) (Alpha mannosidase 6A8B) Query: 1 HEAHKFLKVEFPARVRSSQATYEIQFGHLQRPTHYNTSWDWARFEVWAHRWMDLSEHGFG
IGF-1 promotes the development and cytotoxic activity of human NK cells regulated
 Supplementary Information for IGF-1 promotes the development and cytotoxic activity of human NK cells regulated by mir-483-3p Fang Ni 1, 2, Rui Sun 1, Binqing Fu 1, Fuyan Wang 1, Chuang Guo 1, Zhigang
Supplementary Information. Conversion of vascular endothelial cells into multipotent stem-like cells
 Supplementary Information Conversion of vascular endothelial cells into multipotent stem-like cells Damian Medici 1, Eileen M. Shore 2,3,4, Vitali Y. Lounev 2,4, Frederick S. Kaplan 2,4,5, Raghu Kalluri
Supplementary Figure S1. The tetracycline-inducible CRISPR system. A) Hela cells stably
 Hela cells stably") Supplementary Information Supplementary Figure S1. The tetracycline-inducible CRISPR system. A) Hela cells stably expressing shrna sequences against TRF2 were examined by western blotting. shcon, shrna
Supplementary Information Supplementary Figure S1. The tetracycline-inducible CRISPR system. A) Hela cells stably expressing shrna sequences against TRF2 were examined by western blotting. shcon, shrna
Appendix Figures Page 2 Appendix Figure Legends Page 9 Appendix Tables Page 13 Appendix Supplementary Methods Page 15 Appendix References Page 17
 APPENDIX Appendix Figures Page 2 Appendix Figure Legends Page 9 Appendix Tables Page 13 Appendix Supplementary Methods Page 15 Appendix References Page 17 Appendix Figure Legends Appendix Figure
SUPPLEMENTARY INFORMATION
 SUPPLEMENTARY INFORMATION DOI: 1.138/NMAT3777 Biophysical regulation of epigenetic state and cell reprogramming Authors: Timothy L. Downing 1,2, Jennifer Soto 1,2, Constant Morez 2,3,, Timothee Houssin
SUPPLEMENTARY INFORMATION
 DOI: 10.1038/ncb2743 Figure S1 stabilizes cellular protein level, post-transcriptionally. (a, b) and DDR1 were RNAi-depleted from HEK.293.-CBG cells. Western blots with indicated antibodies (a). RT-PCRs
MiR-150 promotes cellular metastasis in non-small cell lung cancer by targeting
 MiR-150 promotes cellular metastasis in non-small cell lung cancer by targeting FOXO4 Hui Li 1, #, Ruoyun Ouyang 2, #, Zi Wang 1, #, Weihua Zhou 1, Huiyong Chen 1, Yawen Jiang 1, Yibin Zhang 1, Hui Li
Supplemental Information. The TRAIL-Induced Cancer Secretome. Promotes a Tumor-Supportive Immune. Microenvironment via CCR2
 Molecular Cell, Volume 65 Supplemental Information The TRAIL-Induced Cancer Secretome Promotes a Tumor-Supportive Immune Microenvironment via CCR2 Torsten Hartwig, Antonella Montinaro, Silvia von Karstedt,
Supplementary Figure 1. Adipogenic protein expression in WT and KO MEFs after 7 days of adipogenic differentiation.
 Merkestein et al. Supplementary Figure 1 A PLIN WT FTO KO 72 kda FABP4 17 kda HSC70 72 kda B Supplementary Figure 1. Adipogenic protein expression in WT and KO MEFs after 7 days of adipogenic differentiation.
The non-muscle-myosin-ii heavy chain Myh9 mediates colitis-induced epithelium injury by restricting Lgr5+ stem cells
 Supplementary Information The non-muscle-myosin-ii heavy chain Myh9 mediates colitis-induced epithelium injury by restricting Lgr5+ stem cells Bing Zhao 1,3, Zhen Qi 1,3, Yehua Li 1,3, Chongkai Wang 2,
Supplementary Figure 1. IFN-γ induces TRC dormancy. a, IFN-γ induced dormancy
 Supplementary Figure 1. IFN-γ induces TRC dormancy. a, IFN-γ induced dormancy of various tumor type TRCs, including H22 (murine hepatocarcinoma) and CT26 (murine colon cancer). Bar, 50 µm. b, B16 cells
SUPPLEMENTARY INFORMATION
 doi:.38/nature899 Supplementary Figure Suzuki et al. a c p7 -/- / WT ratio (+)/(-) p7 -/- / WT ratio Log X 3. Fold change by treatment ( (+)/(-)) Log X.5 3-3. -. b Fold change by treatment ( (+)/(-)) 8
Supplementary Table-1: List of genes that were identically matched between the ST2 and
 Supplementary data Supplementary Table-1: List of genes that were identically matched between the ST2 and ST3. Supplementary Table-2: List of genes that were differentially expressed in GD2 + cells compared
GFP CCD2 GFP IP:GFP
 D1 D2 1 75 95 148 178 492 GFP CCD1 CCD2 CCD2 GFP D1 D2 GFP D1 D2 Beclin 1 IB:GFP IP:GFP Supplementary Figure 1: Mapping domains required for binding to HEK293T cells are transfected with EGFP-tagged mutant
Supplemental Figure 1: CIP2A and SET levels are increased in some. primary human pancreatic cancer samples. (A) CIP2A mrna levels were
 CIP2A mrna levels were") Supplemental Figure Legends and Figures: Supplemental Figure 1: CIP2A and SET levels are increased in some primary human pancreatic cancer samples. (A) CIP2A mrna levels were measured in 3 benign (non-cancer)
Supplemental Figure Legends and Figures: Supplemental Figure 1: CIP2A and SET levels are increased in some primary human pancreatic cancer samples. (A) CIP2A mrna levels were measured in 3 benign (non-cancer)
Table 1. Primers, annealing temperatures, and product sizes for PCR amplification.
 Table 1. Primers, annealing temperatures, and product sizes for PCR amplification. Gene Direction Primer sequence (5 3 ) Annealing Temperature Size (bp) BRCA1 Forward TTGCGGGAGGAAAATGGGTAGTTA 50 o C 292
Inhibition of Twist1 mediated invasion by Chk2 promotes premature senescence in p53 defective cancer cells
 Inhibition of Twist1 mediated invasion by Chk2 promotes premature senescence in p53 defective cancer cells Debasis Nayak, a,1 Anmol Kumar, b Souneek Chakraborty, a,1 Reyaz ur Rasool, a,1 Hina Amin, a Archana
Nature Structural & Molecular Biology: doi: /nsmb Supplementary Figure 1
 Supplementary Figure 1 Endogenous gene tagging to study subcellular localization and chromatin binding. a, b, Schematic of experimental set-up to endogenously tag RNAi factors using the CRISPR Cas9 technology,
Supplementary Figure 1. Characterization of the POP2 transcriptional and post-transcriptional regulatory elements. (A) POP2 nucleotide sequence
 POP2 nucleotide sequence") 1 5 6 7 8 9 10 11 1 1 1 Supplementary Figure 1. Characterization of the POP transcriptional and post-transcriptional regulatory elements. (A) POP nucleotide sequence depicting the consensus sequence for
1 5 6 7 8 9 10 11 1 1 1 Supplementary Figure 1. Characterization of the POP transcriptional and post-transcriptional regulatory elements. (A) POP nucleotide sequence depicting the consensus sequence for
Supplementary Figure 1. (a) The qrt-pcr for lnc-2, lnc-6 and lnc-7 RNA level in DU145, 22Rv1, wild type HCT116 and HCT116 Dicer ex5 cells transfected
 The qrt-pcr for lnc-2, lnc-6 and lnc-7 RNA level in DU145, 22Rv1, wild type HCT116 and HCT116 Dicer ex5 cells transfected") Supplementary Figure 1. (a) The qrt-pcr for lnc-2, lnc-6 and lnc-7 RNA level in DU145, 22Rv1, wild type HCT116 and HCT116 Dicer ex5 cells transfected with the sirna against lnc-2, lnc-6, lnc-7, and the
Supplementary Figure 1. (a) The qrt-pcr for lnc-2, lnc-6 and lnc-7 RNA level in DU145, 22Rv1, wild type HCT116 and HCT116 Dicer ex5 cells transfected with the sirna against lnc-2, lnc-6, lnc-7, and the
SUPPLEMENTAL FIGURES AND TABLES
 SUPPLEMENTAL FIGURES AND TABLES A B Flag-ALDH1A1 IP: α-ac HEK293T WT 91R 128R 252Q 367R 41/ 419R 435R 495R 412R C Flag-ALDH1A1 NAM IP: HEK293T + + - + D NAM - + + E Relative ALDH1A1 activity 1..8.6.4.2
Nature Medicine: doi: /nm.4169
 Supplementary Fig.1. EC-specific deletion of Ccm3 by Cdh5-CreERT2. a. mt/mg reporter mice were bred with Cdh5CreERT2 deleter mice followed by tamoxifen feeding from P1 to P3. mg expression was specifically
Fig. S1. eif6 expression in HEK293 transfected with shrna against eif6 or pcmv-eif6 vector.
 Fig. S1. eif6 expression in HEK293 transfected with shrna against eif6 or pcmv-eif6 vector. (a) Western blotting analysis and (b) qpcr analysis of eif6 expression in HEK293 T cells transfected with either
Supplementary Figure 1 Validate the expression of mir-302b after bacterial infection by northern
 Supplementary Figure 1 Validate the expression of mir-302b after bacterial infection by northern blot. Northern blot analysis of mir-302b expression following infection with PAO1, PAK and Kp in (A) lung
Mammosphere formation assay. Mammosphere culture was performed as previously described (13,
 Supplemental Text Materials and Methods Mammosphere formation assay. Mammosphere culture was performed as previously described (13, 17). For co-culture with fibroblasts and treatment with CM or CCL2, fibroblasts
Supplementary Figure 1. Expressions of stem cell markers decreased in TRCs on 2D plastic. TRCs were cultured on plastic for 1, 3, 5, or 7 days,
 Supplementary Figure 1. Expressions of stem cell markers decreased in TRCs on 2D plastic. TRCs were cultured on plastic for 1, 3, 5, or 7 days, respectively, and their mrnas were quantified by real time
Nature Medicine: doi: /nm.4464
 Supplementary Fig. 1. Amino acid transporters and substrates used for selectivity screening. (A) Common transporters and amino acid substrates shown. Amino acids designated by one-letter codes. Transporters
Supplementary Figure S1
 Supplementary Figure S1 Supplementary Figure S1. CD11b expression on different B cell subsets in anti-snrnp Ig Tg mice. (a) Highly purified follicular (FO) and marginal zone (MZ) B cells were sorted from
(a) Immunoblotting to show the migration position of Flag-tagged MAVS
 Immunoblotting to show the migration position of Flag-tagged MAVS") Supplementary Figure 1 Characterization of six MAVS isoforms. (a) Immunoblotting to show the migration position of Flag-tagged MAVS isoforms. HEK293T Mavs -/- cells were transfected with constructs expressing
Supplementary Figure 1 Characterization of six MAVS isoforms. (a) Immunoblotting to show the migration position of Flag-tagged MAVS isoforms. HEK293T Mavs -/- cells were transfected with constructs expressing
Supplementary Information for Transient and Local Expression of Chemokine and Immune Checkpoint Traps to Treat Pancreatic Cancer
 Supplementary Information for Transient and Local Expression of Chemokine and Immune Checkpoint Traps to Treat Pancreatic Cancer Lei Miao 1, Jingjing Li 2, Qi Liu 1,4, Richard Feng 2, Manisit Das 1, C.
Kazuki N. Sugahara, Tambet Teesalu, Priya Prakash Karmali, Venkata Ramana Kotamraju, Lilach
 Cancer Cell, Volume 16 Supplemental Data Tissue-Penetrating Delivery of Compounds and Nanoparticles into Tumors Kazuki N. Sugahara, Tambet Teesalu, Priya Prakash Karmali, Venkata Ramana Kotamraju, Lilach
Supplementary Information
 Supplementary Information Supplementary Figure 1: Identification of new regulators of MuSC by a proteome-based shrna screen. (a) FACS plots of GFP + and GFP - cells from Pax7 ICN -Z/EG (upper panel) and
Supplemental Material: Rev1 promotes replication through UV lesions in conjunction with DNA
 Supplemental Material: Rev1 promotes replication through UV lesions in conjunction with DNA polymerases,, and, but not with DNA polymerase Jung-Hoon Yoon, Jeseong Park, Juan Conde, Maki Wakamiya, Louise
Nature Structural & Molecular Biology: doi: /nsmb Supplementary Figure 1. Analyses of ECTRs by C-circle and T-circle assays.
 Supplementary Figure 1 Analyses of ECTRs by C-circle and T-circle assays. (a) C-circle and (b) T-circle amplification reactions using genomic DNA from different cell lines in the presence (+) or absence
Cancer cells that survive radiation therapy acquire HIF-1 activity and translocate toward tumor blood vessels Supplementary Information
 Cancer cells that survive radiation therapy acquire HIF-1 activity and translocate toward tumor blood vessels Supplementary Information 1. Supplementary Figure S1-S10: Pages 2-11 2. Supplementary References:
Fig. S1. Effect of p120-catenin overexpression on the interaction of SCUBE2 with E-cadherin. The expression plasmid encoding FLAG.
 Fig. S1. Effect of p120-catenin overexpression on the interaction of SCUBE2 with E-cadherin. The expression plasmid encoding FLAG.SCUBE2, E-cadherin.Myc, or HA.p120-catenin was transfected in a combination
TIB6 B16F1 LLC EL4. n=2 n=7 n=9 n=6
 Shojaei et al., Supplemental Fig. 1 9 Mean Inhibition by anti-vegf (%) 7 5 3 1 TIB6 n=2 n=7 n=9 n=6 Supplemental Figure 1 Differential growth inhibition by anti-vegf treatment. The percent of tumor growth
Supplemental material
 Supplemental material THE JOURNAL OF CELL BIOLOGY Taylor et al., http://www.jcb.org/cgi/content/full/jcb.201403021/dc1 Figure S1. Representative images of Cav 1a -YFP mutants with and without LMB treatment.
SUPPLEMENTARY INFORMATION
 VOLUME: 1 ARTICLE NUMBER: 0011 In the format provided by the authors and unedited. In situ Activation of Platelets with Checkpoint Inhibitors for Post-Surgical Cancer Immunotherapy Chao Wang 1, 2, Wujin
Hyper sensitive protein detection by Tandem-HTRF reveals Cyclin D1
 Hyper sensitive protein detection by Tandem-HTRF reveals Cyclin D1 dynamics in adult mouse Alexandre Zampieri, Julien Champagne, Baptiste Auzemery, Ivanna Fuentes, Benjamin Maurel and Frédéric Bienvenu
Supplementary Figure 1. APP cleavage assay. HEK293 cells were transfected with various
 Supplementary Figure 1. APP cleavage assay. HEK293 cells were transfected with various GST-tagged N-terminal truncated APP fragments including GST-APP full-length (FL), APP (123-695), APP (189-695), or
Cell culture and drug treatment. Lineage - Sca-1+ CD31+ EPCs were cultured on
 Supplemental Material Detailed Methods Cell culture and drug treatment. Lineage - Sca-1+ CD31+ EPCs were cultured on 5µg/mL human fibronectin coated plates in DMEM supplemented with 10% FBS and penicillin/streptomycin
Supplementary Figure 1. Confirmation of sirna in PC3 and H1299 cells PC3 (a) and H1299 (b) cells were transfected with sirna oligonucleotides
 and H1299 (b) cells were transfected with sirna oligonucleotides") Supplementary Figure 1. Confirmation of sirna in PC3 and H1299 cells PC3 (a) and H1299 (b) cells were transfected with sirna oligonucleotides targeting RCP (SMARTPool (RCP) or two individual oligos (RCP#1
Supplementary Figure 1. Confirmation of sirna in PC3 and H1299 cells PC3 (a) and H1299 (b) cells were transfected with sirna oligonucleotides targeting RCP (SMARTPool (RCP) or two individual oligos (RCP#1
(A-B) P2ry14 expression was assessed by (A) genotyping (upper arrow: WT; lower
 P2ry14 expression was assessed by (A) genotyping (upper arrow: WT; lower") Supplementary Figures S1. (A-B) P2ry14 expression was assessed by (A) genotyping (upper arrow: ; lower arrow: KO) and (B) q-pcr analysis with Lin- cells, The white vertical line in panel A indicates that
Supplementary Figures S1. (A-B) P2ry14 expression was assessed by (A) genotyping (upper arrow: ; lower arrow: KO) and (B) q-pcr analysis with Lin- cells, The white vertical line in panel A indicates that
Supplementary Figure 1. ips_3y+mir-302b. ips_3y+mir-372. ips_3y+mir-302b + mir-372. ips_4y. ips_4y+mir-302b. ips_4y + mir-372
 Supplementary Figure 1 ips_3y+mir-32b ips_3y+ ips_3y+mir-32b + ips_4y ips_4y+mir-32b ips_4y + Nature Biotechnology: doi:1.138/nb.t.1862 TRA-1-6 DAPI Oct3/4 Supplementary Figure 1: ips cells derived from
Supplementary Information Alternative splicing of CD44 mrna by ESRP1 enhances lung colonization of metastatic cancer cell
 Supplementary Information Alternative splicing of CD44 mrna by ESRP1 enhances lung colonization of metastatic cancer cell Supplementary Figures S1-S3 Supplementary Methods Supplementary Figure S1. Identification
Nature Biotechnology: doi: /nbt Supplementary Figure 1
 Supplementary Figure 1 Schematic and results of screening the combinatorial antibody library for Sox2 replacement activity. A single batch of MEFs were plated and transduced with doxycycline inducible
somatic transition to was evident into airways in the
 Supplementary Fig. 1. A. Activation of an oncogenic K-Ras allele by recombination in somatic cells leads to spontaneous lung cancer in LA1 mice (ref. 20). In this mouse model, subpleural precancerous adenomas
Supplementary Figure 1. Xbp1 deficiency does not alter hematopoietic cellularity.
 Supplementary Figure 1 Xbp1 deficiency does not alter hematopoietic cellularity. Absolute number of leukocytes obtained from bone marrow (BM, 2 tibias and 2 femurs per mouse) of Xbp1 f/f and Xbp1 Vav1
RNA was isolated using NucleoSpin RNA II (Macherey-Nagel, Bethlehem, PA) according to the
 according to the") Supplementary Methods RT-PCR and real-time PCR analysis RNA was isolated using NucleoSpin RNA II (Macherey-Nagel, Bethlehem, PA) according to the manufacturer s protocol and quantified by measuring the
Supplementary Methods RT-PCR and real-time PCR analysis RNA was isolated using NucleoSpin RNA II (Macherey-Nagel, Bethlehem, PA) according to the manufacturer s protocol and quantified by measuring the
SUPPLEMENTARY INFORMATION
 SUPPLEMENTARY INFORMATION doi:10.1038/nature12138 Supplementary Figure 1. Knockdown of KRAS leads to a reduction in macropinocytosis. (a) KRAS knockdown in MIA PaCa-2 cells expressing KRASspecific shrnas
immunofluorescence. Name of antibodies Manufacturer Catalog Number Rabbit anti-pdyn Rabbit anti-kor-1
 Supplemental Tables Table S1. List of primary antibodies used for immunohistochemistry, FACS, and immunofluorescence. Name of antibodies Manufacturer Catalog Number Rabbit anti-pdyn Bioss USA bs-13041r
initial single-cell analysis, with a pragmatic focus on surface markers with the highest potential for
 Supplementary Figure 1: Summary of the exclusionary approach to surface marker selection for initial single-cell analysis, with a pragmatic focus on surface markers with the highest potential for protein
14_integrins_EGFR
 α1 Integrin α1 -/- fibroblasts from integrin α1 knockout animals Figure S1. Serum-starved fibroblasts from α -/- 1 and +/+ mice were stimulated with 10% FBS for 30 min. (FBS) or plated on collagen I (CI)
Gene Forward (5 to 3 ) Reverse (5 to 3 ) Accession # PKA C- TCTGAGGAAATGGGAGAACC CGAGGGTTTTCTTCCTCTCAA NM_011100
 Reverse (5 to 3 ) Accession # PKA C- TCTGAGGAAATGGGAGAACC CGAGGGTTTTCTTCCTCTCAA NM_011100") Supplementary Methods: Materials. BRL37344, insulin, 3-isobutyl-1-methylxanthine, dibutyryl camp (Bt2-cAMP) and 8-Bromoadenosine 3,5 -cyclic monophosphate sodium (8-br-cAMP), cilostamide, adenosine deaminase,
Supplementary Methods: Materials. BRL37344, insulin, 3-isobutyl-1-methylxanthine, dibutyryl camp (Bt2-cAMP) and 8-Bromoadenosine 3,5 -cyclic monophosphate sodium (8-br-cAMP), cilostamide, adenosine deaminase,
* * IgL locus (V - J ) λ λ
 λ λ") Supplementary Figures and Figure Legend Supplementary Figure S1 A C F Vav-P-BCL2 doner mice 8 6 4 2 Lymphoma free (%)1 Tumor Pathology Score Retroviral transduction Vav-P-BCL2 HPCs HPC + shrna VavP-Bcl2
Supplementary Figures and Figure Legend Supplementary Figure S1 A C F Vav-P-BCL2 doner mice 8 6 4 2 Lymphoma free (%)1 Tumor Pathology Score Retroviral transduction Vav-P-BCL2 HPCs HPC + shrna VavP-Bcl2
HCT116 SW48 Nutlin: p53
 Figure S HCT6 SW8 Nutlin: - + - + p GAPDH Figure S. Nutlin- treatment induces p protein. HCT6 and SW8 cells were left untreated or treated for 8 hr with Nutlin- ( µm) to up-regulate p. Whole cell lysates
CDK5 is essential for TGF-β1-induced epithelial-mesenchymal transition and breast cancer progression
 Supplementary information for: CDK5 is essential for TGF-β1-induced epithelial-mesenchymal transition and breast cancer progression Qian Liang, Lili Li, Jianchao Zhang, Yang Lei, Liping Wang, Dong-Xu Liu,
1. Primers for PCR to amplify hairpin stem-loop precursor mir-145 plus different flanking sequence from human genomic DNA.
 Supplemental data: 1. Primers for PCR to amplify hairpin stem-loop precursor mir-145 plus different flanking sequence from human genomic DNA. Strategy#1: 20nt at both sides: #1_BglII-Fd primer : 5 -gga
Transcriptional regulation of BRCA1 expression by a metabolic switch: Di, Fernandez, De Siervi, Longo, and Gardner. H3K4Me3
 ChIP H3K4Me3 enrichment.25.2.15.1.5 H3K4Me3 H3K4Me3 ctrl H3K4Me3 + E2 NS + E2 1. kb kb +82 kb Figure S1. Estrogen promotes entry of MCF-7 into the cell cycle but does not significantly change activation-associated
Supplementary Figure 1. Bone density was decreased in osteoclast-lineage cell specific Gna13 deficient mice. (a-c) PCR genotyping of mice by mouse
 PCR genotyping of mice by mouse") Supplementary Figure 1. Bone density was decreased in osteoclast-lineage cell specific Gna13 deficient mice. (a-c) PCR genotyping of mice by mouse tail DNA. Primers were designed to detect Gna13-WT/f (~400bp/470bp)
Supplementary Figure 1. Bone density was decreased in osteoclast-lineage cell specific Gna13 deficient mice. (a-c) PCR genotyping of mice by mouse tail DNA. Primers were designed to detect Gna13-WT/f (~400bp/470bp)
Supplementary Figure 1. Localization of MST1 in RPE cells. Proliferating or ciliated HA- MST1 expressing RPE cells (see Fig. 5b for establishment of
 Supplementary Figure 1. Localization of MST1 in RPE cells. Proliferating or ciliated HA- MST1 expressing RPE cells (see Fig. 5b for establishment of the cell line) were immunostained for HA, acetylated
SUPPLEMENTARY INFORMATION
 DOI: 10.1038/ncb2386 Figure 1 Src-containing puncta are not focal adhesions, podosomes or endosomes. (a) FAK-/- were stained with anti-py416 Src (green) and either (in red) the focal adhesion protein paxillin,
Supplementary information for: Mutant p53 gain-of-function induces epithelial-mesenchymal transition. through modulation of the mir-130b-zeb1 axis
 Supplementary information for: Mutant p53 gain-of-function induces epithelial-mesenchymal transition through modulation of the mir-3b-zeb axis AUTHORS: Peixin Dong, Mihriban Karaayvaz, Nan Jia, Masanori
We performed RT-PCR, cloning, sequencing and qrt-pcr in murine melanoma. cell lines and melanocytic tumors from RET-mice in accordance with the method
 Supplementary Material and Methods Quantitative RT-PCR (qrt-pcr) We performed RT-PCR, cloning, sequencing and qrt-pcr in murine melanoma cell lines and melanocytic tumors from RET-mice in accordance with
Supplemental Materials. Matrix Proteases Contribute to Progression of Pelvic Organ Prolapse in Mice and Humans
 Supplemental Materials Matrix Proteases Contribute to Progression of Pelvic Organ Prolapse in Mice and Humans Madhusudhan Budatha, Shayzreen Roshanravan, Qian Zheng, Cecilia Weislander, Shelby L. Chapman,
Supplementary Figure 1 A green: cytokeratin 8
 Supplementary Figure 1 A green: cytokeratin 8 green: α-sma red: α-sma blue: DAPI blue: DAPI Panc-1 Panc-1 Panc-1+hPSC Panc-1+hPSC monoculture coculture B Suppl. Figure 1: A, Immunofluorescence staining
Khaled_Fig. S MITF TYROSINASE R²= MITF PDE4D R²= Variance from mean mrna expression
 Khaled_Fig. S Variance from mean mrna expression.8 2 MITF.6 TYROSINASE.4 R²=.73.2.8.6.4.2.8.6.4.2.8.6.4.2 MALME3M SKMEL28 UACC257 MITF PDE4D R²=.63 4.5 5 MITF 3.5 4 PDE4B 2.5 3 R²=.2.5 2.5.8.6.4.2.8.6.4.2