ESTIMATING THE CHANGE IN ECOSYSTEM SERVICES DUE TO SHALE GAS EXTRACTION IN PENNSYLVANIA
|
|
|
- Jason Palmer
- 6 years ago
- Views:
Transcription
1 ESTIMATING THE CHANGE IN ECOSYSTEM SERVICES DUE TO SHALE GAS EXTRACTION IN PENNSYLVANIA David Murphy, Ph.D. Environmental Science Division, Argonne National Lab Northern Illinois University ACES and Ecosystem Markets 2012 Ft. Lauderdale, Florida

2

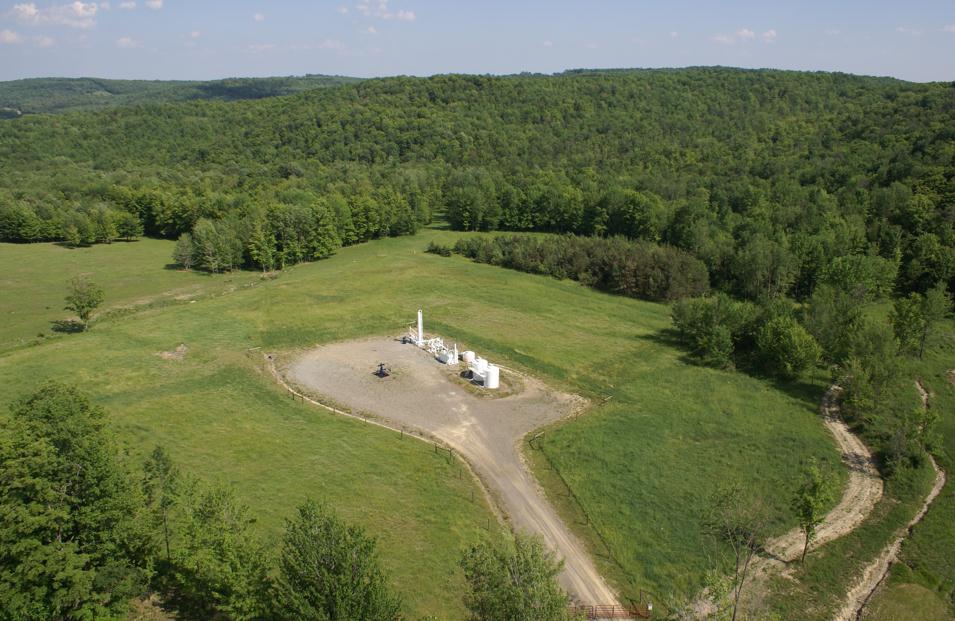
3 Gas Extraction in the Marcellus Shale

4 Hydraulic Fracturing and Horizontal Drilling Marcellus wells consume between 3 and 6 million gallons of fresh water per well Google images

5
6
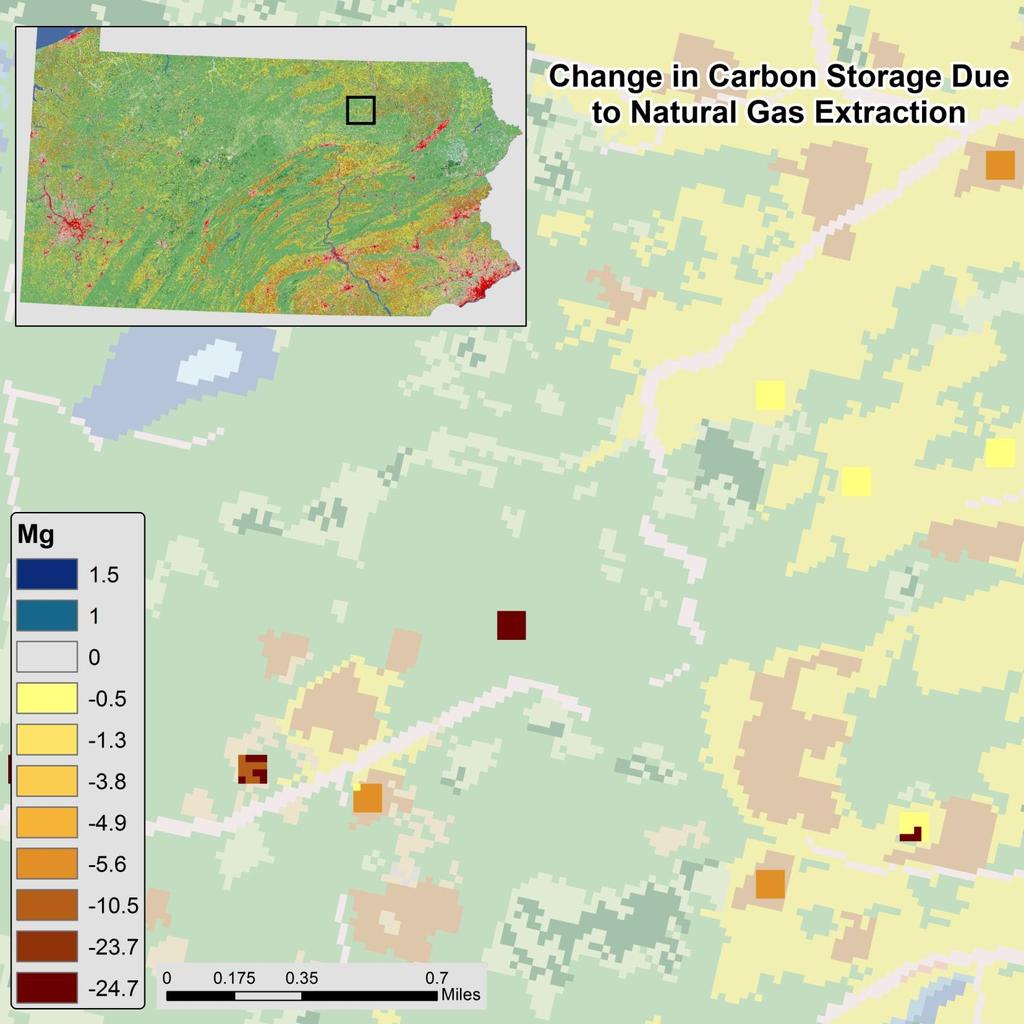
7 How is this land-cover change impacting the provision of ecosystem services?
 Well-Pad Location Lots of ArcGIS (120m x 120m = 3.")
8 Land-Cover Change Model: Convert Well Location Data to Well-Pads Well-Location (up to 15 wells per pad) Well-Pad Location Lots of ArcGIS (120m x 120m = 3.5 ac)
9

10
11 CARBON STORAGE AND SEQUESTRATION: METHODS AND RESULTS
12 Carbon Storage Carbon Storage = above ground carbon + below ground carbon + soil carbon +dead carbon
13 Carbon Pools (Tonnes per Ha) Above Below Ground Ground Soil Dead Developed High Intensity Barren Land Deciduous Forest Evergreen Forest Mixed Forest Grassland/Herbaceous Pasture/Hay Cultivated Crops
14
15 Total Loss of Stored Carbon (10 3 Mg) Developed Open Space Developed Low Intensity Barren Land Deciduous Forest Evergreen Forest Mixed Forest Shrub/Scrub Grassland/Herbaceous Pasture/Hay Cul vated Crop
16
17
18 Total Cost = $4 to $120 million
19 RESERVOIR HYDROPOWER PRODUCTION: METHODS AND (INTERMEDIATE) RESULTS
20 Why Hydropower Production Tradeoff between Land-cover change and water consumption Between 3 and 6 million gallons of water are used per well in the marcellus Land-cover change increases water run-off and (potentially) hydropower production
21 Water Yield Inputs: Precip, PoEt, Soil Depth, PAWC, Land Cover, Watershed boundaries, Biophysical table (root depth, EtK) Outputs: total and mean water yield volume per sub-watershed (rasters), Watershed Yield Table (dbf attribute table), Subwatershed Yield Table (dbf attribute table)
 Mean Water Yield")
22 Water Yield Outputs Total Water Yield (Volume) Mean Water Yield
23 Water Scarcity Inputs: Total and mean water yield per sub-watershed, landcover, Yield tables, water demand table, hydropower calibration table Outputs: Calibrated water yield volume, water consumption volume, watershed and subwatershed scarcity table
24
25 Water Scarcity Outputs Calibrated Water Yield (Volume) Water Consumption (Volume)

26 Model Validation
 160 Number of wells (high")
27 Water Consumption 2006 (m 3 ) Water Consumption 2011 (m 3 ) Difference Number of Wells (low consumption) 160 Number of wells (high consumption) 80
28 Valuation Inputs: Calibrated water yield, water consumption, hydropower valuation Outputs: hydropower energy production, hydropower energy value ($)
29 Model Validation Annual Hydropower Production (GWh) Actual 2341 InVEST Model Calibration Ratio (Model / Actual) Hydropower Valuation (Billion $)* Gross Adjusted Annual Ecosystem Service Year Value of Ecosystem Service *Assumed $0.07 per kwh 6 ***Change in hydropower production from gas extraction is insignificant
30 Questions/Comments? Contact Information
31 Appendix A: Points to Wellpad Conversion in ArcGIS

32 Convert X,Y coordinates from well data to point features

 Buffer the wells by 100")
33 ** The borders were dissolved so that any overlapping buffers become a single feature (next step) Buffer the wells by 100 meters


34 In this case, the ActiveWell_Buffer feature is a single feature that is converted to multiple features. All buffer features that do not intersect another buffer feature are split into individual features. In this case, 1923 features were created. Convert the dissolved buffers to individual features


35 Join the well data (from the point file) to the buffered features The spatial join allows the user to attach data from the input features to the join features. In this case, the sum of gas production and gas quantity were calculated as well as the average lat/long of the wells.

36 The average lat/long values (of the wells) from the spatial join are used to create wellpad centroids


37 Wellpad centroids are then converted to a raster with 120m resolution cells
38 Wellpad raster is resampled so that the 120m cells match the 30m resolution of the NLCD raster

39 Is Null tool assigns all no data values within the input raster (Resample wellpads) as 1. All other values are given a 0. In this case, all wellpads are 0 and the remaining cells are 1.


40 The output raster from the previous step is reclassified so that all wellpads (formerly classified as 0) are now classified as 24 (matching the appropriate NLCD classification)
 are now")
 Pre Wellpad Development Post Wellpad")
41 The output raster from the previous step is reclassified so that all wellpads (formerly classified as 0) are now classified as 24 (matching the appropriate NLCD classification) Pre Wellpad Development Post Wellpad Development
42 Appendix B: Data Sources
43 Data Sources: Water Yield Annual Precipitation o Prism Climate Group (Oregon State University) Potential Evapotranspiration o Oak Ridge National Laboratory Soil Depth and Plant Available Water Content o USDA Natural Resources Conservation Service Land Use o Multi-Resolution Land Characteristics Consortium (MRLC) Watersheds and Sub-watersheds o U.S. Geological Survey Biophysical Attributes o Reclassification of the sample biophysical table
44 Carbon Pool Data OID C_above C_below C_soil C_dead LULC LULC_Name Open Water Perrenial Ice/Snow Developed Open Space Developed Low Intensity Developed Medium Intensity Developed High Intensity Barren Land Deciduous Forest Evergreen Forest Mixed Forest Dwarf Shrub Shrub/Scrub Grassland/Herbaceous Sedge/Herbaceous Lichens Moss Pasture/Hay Cultivated Crops Woody Wetland Emergent Herbaceous Wetlands
45 Data Sources: Water Scarcity Water Demand Table o Reclassification of sample data to match NLCD classifications Hydropower Calibration Table o National Inventory of Dams (U.S. Army Corps of Engineers)
46 Data Sources: Valuation Hydropower Valuation Table o National Inventory of Dams (U.S. Army Corps of Engineers)
47 Appendix C: Full list of inputs and outputs per model for Reservoir Hydropower Production
48 Water Yield Data Needs Annual Precipitation (raster) Potential Evapotranspiration (raster) Outputs Total Water Yield Volume per subwatershed (raster) Soil Depth (raster) Plant Available Water Content (raster) Land Cover (raster) Watershed and Subwatershed boundaries (shapefile/feature class) Biophysical Table (dbf attribute table) Mean Water Yield per sub-watershed (raster) Watershed Yield Table (dbf attribute table) Sub-watershed Yield Table (dbf attribute table)
49 Water Scarcity Data Needs Total Water Yield Volume per sub-watershed (raster) Mean Water Yield per subwatershed (raster) Land Use (raster) Watershed and Sub-watershed boundaries (shapefile/feature class) Watershed Yield Table (dbf attribute table) Sub-watershed Yield Table (dbf attribute table) Water Demand Table (dbf attribute Table) Outputs Calibrated Water Yield Volume (raster) Water Consumption Volume (raster) Watershed Scarcity Table (dbf attribute table) Sub-watershed Scarcity Table (dbf attribute table) Hydropower Calibration Table (dbf attribute table)
50 Hydropower Valuation Data Needs Calibrated Water Yield Volume (raster) Water Consumption Volume (raster) Watershed and Subwatershed boundaries (shapefile/feature class) Watershed Scarcity Table (dbf attribute table) Sub-watershed Scarcity Table (dbf attribute table) Hydropower Valuation Table (dbf attribute table) Outputs Hydropower Energy (sub-watershed energy production) Hydropower Value (subwatershed hydropower value) Watershed Hydropower Value (dbf table) Sub-watershed Hydropower Value (dbf table)
Trillion Dollar Valley. The Natural Economy of Alaska s Mat-Su Basin
 Trillion Dollar Valley The Natural Economy of Alaska s Mat-Su Basin November 13, 2013 Four Types of Capital Built Capital Social Capital Human Capital Natural Capital http://www.trekearth.com/gallery/asia/india/north/jammu_and_kashmir/gurez/photo1160427.htm
A Multi-Criteria Evaluation of Wind Power in Montana
 A Multi-Criteria Evaluation of Wind Power in Montana Finding the top 5 incorporated Cities Mia Lieb-Lappen Middlebury College December 7, 2009 Word Count: 968 I. INDRODUCTION Montana has the 5 th highest
USING ARCSWAT TO EVALUATE EFFECTS OF LAND USE CHANGE ON WATER QUALITY. Adam Gold Geog 591
 USING ARCSWAT TO EVALUATE EFFECTS OF LAND USE CHANGE ON WATER QUALITY Adam Gold Geog 591 Introduction The Soil and Water Assessment Tool (SWAT) is a hydrologic transport model with an objective to predict
TARGETING WATERSHEDS FOR RESTORATION ACTIVITIES IN THE CHESAPEAKE BAY WATERSHED. Technical Documentation October 4, 2002
 TARGETING WATERSHEDS FOR RESTORATION ACTIVITIES IN THE CHESAPEAKE BAY WATERSHED Technical Documentation October 4, 2002 Acknowledgements and Disclaimer This project was funded by the Chesapeake Bay Foundation,
i-tree Landscape Methods, Limitations and Uncertainties
 i-tree Landscape Methods, Limitations and Uncertainties i-tree Landscape is an easy-to-use tool designed to: a) Provide statistics on land cover, human populations and ecosystem services at the block group
Estimation of Casper Aquifer Recharge using the Soil-Water Balance Model
 Estimation of Casper Aquifer Recharge using the Soil-Water Balance Model July 3, 2008 Prepared by Wittman Hydro Planning Associates, Inc. Bloomington, Indiana Contents 1 Introduction 1 1.1 Regional and
Climate Change and Ecosystem Services: The Contribution of and Impacts on Federal Public Lands in the United States
 Climate Change and Ecosystem Services: The Contribution of and Impacts on Federal Public Lands in the United States Valerie Esposito, Spencer Phillips, Roelof Boumans, Azur Moulaert, and Jennifer Boggs
AN INTEGRATED GROUNDWATER RECHARGE AND FLOW MODEL TO PREDICT BASE FLOW
 AN INTEGRATED GROUNDWATER RECHARGE AND FLOW MODEL TO PREDICT BASE FLOW By XIAOJING NI A THESIS Submitted to Michigan State University in partial fulfillment of the requirements for the degree of Civil
Measuring and Valuing Natural Assets: Ecosystem Services. Steve Polasky University of Minnesota & Natural Capital Project
 Measuring and Valuing Natural Assets: Ecosystem Services Steve Polasky University of Minnesota & Natural Capital Project Introduction Ecosystems, including agricultural systems, provide a wide array of
Identifying Groundwater Dependent Ecosystems in the Edwards Aquifer Area
 Texas A&M University Zachry Department of Civil Engineering Instructor: Dr. Francisco Olivera CVEN658 Civil Engineering Applications of GIS Identifying Groundwater Dependent Ecosystems in the Edwards Aquifer
Ecosystem Services: Provision, Value & Policy. Steve Polasky University of Minnesota & Natural Capital Project
 Ecosystem Services: Provision, Value & Policy Steve Polasky University of Minnesota & Natural Capital Project Introduction Ecosystems provide a wide array of goods and services of value to people Human
San Antonio Water System Mitchell Lake Constructed Wetlands Below the Dam Preliminary Hydrologic Analysis
 San Antonio Water System enhancement. This recommendation was based on limited water quality data provided by SAWS and using a free-water surface constructed wetland with approximately 112 acres of wetted
Stewardship Spatial Analysis Project. Summary Report for Idaho
 Stewardship Spatial Analysis Project Summary Report for Idaho October 2007 Forest Stewardship Spatial Analysis Project Summary Report for Idaho October 2007 Produced by the Idaho Department of Lands Forestry
Assessment of Land Use Change in the Coterminous. Organization of the United Nations
 Assessment of Land Use Change in the Coterminous United States and Alaska for Global Assessment of Forest Loss Conducted by the Food and Agricultural Organization of the United Nations Tanushree Biswas,
Classification of Forest Dominate Types Using an Integrated Landsat and Ecological Model
 Classification of Forest Dominate Types Using an Integrated Landsat and Ecological Model Southern Region Existing Vegetation Mapping Pilot Project Test Supported By Region 8 Engineering/GeoSpatial 3 Year
Working with the Water Balance
 Working with the Water Balance Forest Hydrology and Land Use Change Paul K. Barten, Ph.D. Professor of Forestry and Hydrology Department of Environmental Conservation www.forest-to-faucet.org The Living
Appendix E: Regional Ecosystem Framework Methodology and Calculations
 The data utilized in this scoring methodology are derived from the U.S. Environmental Protection Agency (EPA) Region 6 Geographic Information Systems Screening Tool (GISST) User s Manual, the Texas Grid,
Groundwater Flow Evaluation and Spatial Geochemical Analysis of the Queen City Aquifer, Texas
 Groundwater Flow Evaluation and Spatial Geochemical Analysis of the Queen City Aquifer, Texas Abstract The Queen City Aquifer is a saturated sandstone unit in the coastal plain of East Texas. The goals
MAPPING BIODIVERSITY METRICS REPRESENTING ECOSYSTEM SERVICES AT THE LANDSCAPE SCALE IN THE AMERICAN SOUTHWEST
 MAPPING BIODIVERSITY METRICS REPRESENTING ECOSYSTEM SERVICES AT THE LANDSCAPE SCALE IN THE AMERICAN SOUTHWEST Kenneth G. Boykin 1, William G. Kepner 2, David F. Bradford 2, Kevin J.Gergely 3, and Anne
Mapping global soil Carbon stocks and sequestration potential
 Mapping global soil Carbon stocks and sequestration potential John Latham Renato Cumani UN/FAO Environmental Assessment and Monitoring Unit FAO, Rome, April 16, 2009 1 Food and Agriculture Organization
A Presentation of the 2012 Drainage Research Forum. November 20, 2012 Farmamerica, Waseca MN
 A Presentation of the 2012 Drainage Research Forum November 20, 2012 Farmamerica, Waseca MN 1 Evaluating water quality and quantity outcomes of switching from row crops to perennial biomass crops in a
Pierce County s Green Y
 Rural Meets Urban Pierce County s Green Y The Central Puget Sound Region continues to lose agricultural lands and other open space, especially at the urban fringe. Figure 1 provides a stark image of the
Center for Urban Rural Interface Studies. Pearl River County, Mississippi Land Cover Analysis
 Center for Urban Rural Interface Studies Pearl River County, Mississippi Land Cover Analysis Introduction The Center for Urban Rural Interface Studies (CURIS) created land cover maps for its focus area
David J. Nowak USDA Forest Service
 David J. Nowak USDA Forest Service Overview What is i-tree Eco? Background & Methods Project Steps Putting i-tree Eco to work Questions & Answers Assessing Urban Tree Populations i-tree Eco assesses: Structure
LAKE OKEECHOBEE WATERSHED PROJECT
 LAKE OKEECHOBEE WATERSHED PROJECT INTEGRATED PROJECT IMPLEMENTATION REPORT & ENVIRONMENTAL IMPACT STATEMENT Project Delivery Team Meeting October 5, 2016 Trusted Partners Delivering Value Today for a Better
2.0 Scope of Work. 3.0 Stream Discharge Measurements. Technical Memorandum City of Farmers Branch Page 2
 Technical Memorandum City of Farmers Branch Page 2 over the No. 1 dam. Discharge of commingled water from the reservoirs must be of sufficient quality to meet the Surface Water Quality Standards of Segment
Key requirements of ecosystem service classification for ecosystem accounting
 Key requirements of ecosystem service classification for ecosystem accounting Julian Chow Environmental Economic Accounts Section United Nations Statistics Division Expert Group Meeting Towards a Standard
Patrick Center for Environmental Research
 Patrick Center for Environmental Research MISSION STATEMENT The Patrick Center for Environmental Research, established within the Academy of Natural Sciences in 1947, is a multidisciplinary group of scientists
Preface. Riparian Wetland Restoration Site Selection Using GIS
 Riparian Wetland Restoration Site Selection Using GIS i Preface This bulletin is intended as a guide for managers, planners, and policy-makers involved in wetland restoration projects. This step-by-step
The Science Behind Quantifying Urban Forest Ecosystem Services. David J. Nowak USDA Forest Service Northern Research Station Syracuse, NY, USA
 The Science Behind Quantifying Urban Forest Ecosystem Services David J. Nowak USDA Forest Service Northern Research Station Syracuse, NY, USA Current Model Version 3.0 i-tree Version 4.0 (March 10, 2011)
Vulnerability of hydrological ecosystem services to climatic extremes in a Mediterranean river basin
 Vulnerability of hydrological ecosystem services to climatic extremes in a Mediterranean river basin Marta Terrado, Vicenç Acuña, Driss Ennaanay, Heather Tallis, Sergi Sabater CLIMATIC EXTREMES AND HYDROLOGICAL
Greenhouse Gas (GHG) Status on Land Use Change and Forestry Sector in Myanmar
 Status on Land Use Change and Forestry Sector in Myanmar") Greenhouse Gas (GHG) Status on Land Use Change and Forestry Sector in Myanmar CHO CHO WIN ASSISTANT RESEARCH OFFICER FOREST RESEARCH INSTITUTE YEZIN, MYANMAR International Workshop on Air Quality in Asia-Impacts
Greenhouse Gas (GHG) Status on Land Use Change and Forestry Sector in Myanmar CHO CHO WIN ASSISTANT RESEARCH OFFICER FOREST RESEARCH INSTITUTE YEZIN, MYANMAR International Workshop on Air Quality in Asia-Impacts
A Report on Existing and Possible Tree Canopy in the City of Charlotte and Mecklenburg County, NC
 A Report on Existing and Possible Tree Canopy in the City of Charlotte and Mecklenburg County, NC Why is Tree Canopy Important? Tree canopy (TC) is the layer of leaves, branches, and stems of trees that
Integrated Valuation of Ecosystem Services and Tradeoffs (InVEST): A Tool for Hydropower Management
: A Tool for Hydropower Management") Integrated Valuation of Ecosystem Services and Tradeoffs (InVEST): A Tool for Hydropower Management Heather Tallis, Steve Polasky, Peter Kareiva, Taylor Ricketts, Erik Nelson, Guillermo Mendoza, Jim Regetz,
Integrated Valuation of Ecosystem Services and Tradeoffs (InVEST): A Tool for Hydropower Management Heather Tallis, Steve Polasky, Peter Kareiva, Taylor Ricketts, Erik Nelson, Guillermo Mendoza, Jim Regetz,
Application for Gas Exploration and Production
 1800 Washington Blvd. Suite 655 Baltimore Maryland 21230 Application for Gas Exploration and Production This application is to be used to obtain a permit to Drill and Operate a well, within the State for
Integrating Water Quality and Natural Filters into Maryland s Marine Spatial Planning Efforts
 Integrating Water Quality and Natural Filters into Maryland s Marine Spatial Planning Efforts Nicole Carlozo NOAA Coastal Management Fellow July 31, 2014 Watershed-scale restoration targeting helps direct
Land-Use Threats and Protected Areas: A Scenario-Based, Landscape Level Approach
 Land 2014, 3, 362-389; doi:10.3390/land3020362 Review OPEN ACCESS land ISSN 2073-445X www.mdpi.com/journal/land/ Land-Use Threats and Protected Areas: A Scenario-Based, Landscape Level Approach Tamara
Stream Vulnerability to Widespread and Emergent Stressors: A Focus on Unconventional Oil and Gas
 RESEARCH ARTICLE Stream Vulnerability to Widespread and Emergent Stressors: A Focus on Unconventional Oil and Gas Sally A. Entrekin 1 *, Kelly O. Maloney 2, Katherine E. Kapo 3, Annika W. Walters 4, Michelle
Water Resources Element Appendix
 Appendix Housing Unit Projection Methodology The following assumptions were used to develop the housing unit projections for each Water Resources Element. All projections described in the and this Appendix
Integrated Modeling: ENVISION
 Integrated Modeling: ENVISION Cimarron River Watershed Gehendra Kharel Oklahoma State University Cimarron River Watershed Research and Extension Symposium November 17, 2016 1 Research, Data Archiving,
US CROPLAND EXPANSION RELEASED 115 MILLION TONS OF CARBON ( )
") US CROPLAND EXPANSION RELEASED 115 MILLION TONS OF CARBON (2008-2012) Summary of research presented at the America s Grasslands Conference 11/15/2017, Fort Worth, TX Seth A. Spawn 1,2, Tyler J. Lark 1,
US CROPLAND EXPANSION RELEASED 115 MILLION TONS OF CARBON (2008-2012) Summary of research presented at the America s Grasslands Conference 11/15/2017, Fort Worth, TX Seth A. Spawn 1,2, Tyler J. Lark 1,
State of the Valley Report
 State of the Valley Report An overview of the characteristics and trends of natural resources in the San Joaquin Valley s rural spaces, with an eye on resource sustainability for the future Aerial view
Mean Annual Renewable Water Supply of the Contiguous United States
 23 January 2016 Source of U.S. water supply 1 Mean Annual Renewable Water Supply of the Contiguous United States Thomas C. Brown and Pamela Froemke Rocky Mountain Research Station, U.S. Forest Service,
New Jersey Forest Stewardship Program Spatial Analysis Project Map Products And Data Layers Descriptions
 New Jersey Forest Stewardship Program Spatial Analysis Project 2007 Map Products And Data Layers Descriptions 01/07 NJ Forest Stewardship Program (FSP) Spatial Analysis Project (SAP) Methodology Project
Watershed Health Assessment Framework. Watershed Report Card:
 Watershed Health Assessment Framework "Managng for System Health" Watershed Report Card: People and Places: Watershed Populaton: 2 census - 215 21 census - 182 Largest Ctes - Populaton: Oaks Corner - None
Automated Method to Develop a Clark Synthetic Unit Hydrograph within ArcGIS
 Automated Method to Develop a Clark Synthetic Unit Hydrograph within ArcGIS by Michael Follum PURPOSE: This Coastal and Hydraulics Engineering technical note (CHETN) describes an automated method to develop
Delaware River Basin Commission
 Delaware River Basin Commission Background and Mission of WMAC WMAC Meeting June 16, 2015 Photo by David B. Soete A river is more than an amenity, it is a treasure US Supreme Court Justice Oliver Wendell
Northern Arizona Hydrogeology
 Northern Arizona Hydrogeology Some basics Coconino Plateau Hydrogeology Flagstaff and Coconino Plateau Water Resources Well development, City of Flagstaff Effluent discharge to the Rio de Flag from Wildcat
The Risks and Regulation of Shale Gas Development: Research Findings
 RFF s Center for Energy Economics and Policy The Risks and Regulation of Shale Gas Development: Research Findings Alan Krupnick, PhD Director, Center for Energy Economics and Policy National Governors
Cumulative Risks of Shale Gas Development
 RFF s Center for Energy Economics and Policy Cumulative Risks of Shale Gas Development Alan Krupnick, PhD Director, Center for Energy Economics and Policy Sheila Olmstead, Senior Fellow Presentation to
SOURCES OF VARIABILITY IN DISSOLVED METHANE CONCENTRATIONS AT RESIDENTIAL WATER WELLS
 SOURCES OF VARIABILITY IN DISSOLVED METHANE CONCENTRATIONS AT RESIDENTIAL WATER WELLS Lisa J. Molofsky, Stephen D. Richardson, Thomas E. McHugh, John A. Connor; GSI Environmental Inc. Anthony W. Gorody,
Prioritizing Land Conservation to Protect Water Quality in North Carolina s Triangle Region
 Prioritizing Land Conservation to Protect Water Quality in North Carolina s Triangle Region By Emily Chapin Dr. Dean Urban, Advisor May 2015 Final Draft Masters project submitted in partial fulfillment
Introduction to Core Accounting Principles on SEEA and SNA
 Introduction to Core Accounting Principles on SEEA and SNA Julian Chow United Nations Statistics Division 16-18 November 2015 Shanghai Objectives of the Session Define the scope of measurement in the SEEA
3.1.2 Linkage between this Chapter and the IPCC Guidelines Reporting Categories
 0. INTRODUCTION Chapter provides guidance on the estimation of emissions and removals of CO and non-co for the Land Use, Land-use Change and Forestry (LULUCF) sector, covering Chapter of the Revised IPCC
Southern Blue Ridge: Core Forest Delineation
 Southern Blue Ridge: Core Forest Delineation Written by Rachel Albritton, GIS Analyst Intern In Consultation with David Ray Reviewed by Megan Sutton and Marissa Ponder Drafted August 2012 Finalized June
Marcellus Shale Water Group
 Marcellus Shale Water Group Targeting unconventional oil & gas reservoirs with better ideas, better solutions Our technique of calculating actual production increases the value of your reservoir 1 Predictive
ECOSYSTEMS. Follow along in chapter 54. *Means less important
 ECOSYSTEMS Follow along in chapter 54 *Means less important How do ecosystems function? What is an ecosystem? All living things in an area and their abiotic environment Ecosystem function can be easily
Urban and Community Forests of the South Central East Region
 United States Department of Agriculture Forest Service Northern Research Station General Technical Report NRS-58 Urban and Community Forests of the South Central East Region Alabama Kentucky Mississippi
Gene Fiebich, Autumn Montegna, and Zoe Rodriguez del Rey. Overview
 Using a GIS to Identify and Analyze Dutch Elm Disease Hotspots within the City of Portland Gene Fiebich, Autumn Montegna, and Zoe Rodriguez del Rey Overview Problem Statement Dutch Elm Disease Part 1:
USING REMOTE SENSING AND GEOSPATIAL DATA SETS TO DELINEATE GROUNDWATER DEPENDENT ECOSYSTEMS IN THE UNITED STATES
 1 USING REMOTE SENSING AND GEOSPATIAL DATA SETS TO DELINEATE GROUNDWATER DEPENDENT ECOSYSTEMS IN THE UNITED STATES PRESENTER ISABEL C. PEREZ HOYOS PhD Candidate ADVISORS NIR Y. KRAKAUER REZA KHANBILVARDI
confidence estimates of reserves] using current market conditions and current technologies)
![confidence estimates of reserves] using current market conditions and current technologies)](/thumbs/77/75212719.jpg "confidence estimates of reserves] using current market conditions and current technologies)") Case 1: According to the British Petroleum Statistical Review of World Energy, 2013, global coal reserves declined in the decade ending 2012. Provide an explanation. Conclude with a forecast of coal market
Case 1: According to the British Petroleum Statistical Review of World Energy, 2013, global coal reserves declined in the decade ending 2012. Provide an explanation. Conclude with a forecast of coal market
Urban Ecosystem Analysis Mecklenburg County and the City of Charlotte, North Carolina
 April 2010 Urban Ecosystem Analysis Mecklenburg County and the City of Charlotte, North Carolina Calculating the Value of Nature Report Contents 2 Introduction and Project Overview 2-3 Major Findings Summary
MERGANSER - An empirical model to estimate fish and loon Hg in New England lakes
 MERGANSER - An empirical model to estimate fish and loon Hg in New England lakes DTMC webinar, September 6, 2011 Project Team Building MERGANSER 1. Choose base map: National Wetlands Inventory (NWI) 2.
Two Dimensional Modeling to Simulate Stormwater Flows at Photovoltaic Solar Energy Sites
 Two Dimensional Modeling to Simulate Stormwater Flows at Photovoltaic Solar Energy Sites Thomas E. Barnard, 1 Mohamed Agnaou 2 and James Barbis 1 1 Amec Foster Wheeler, Blue Bell, Pennsylvania; 2 Atkins,
PART I: ASSESSMENT OF WETLAND HYDROLOGY AT RESTORATION SITES PART II: CLIMATE CHANGE IMPACTS ON WETLAND HYDROLOGY BOUNDARIES. Mike Vepraskas NC State
 PART I: ASSESSMENT OF WETLAND HYDROLOGY AT RESTORATION SITES PART II: CLIMATE CHANGE IMPACTS ON WETLAND HYDROLOGY BOUNDARIES Mike Vepraskas NC State Do these sites have wetland hydrology? Restored and
Dam Safety Regulations & National Dam Safety Program
 BIA Summer Water Resources Training Dam Safety Inspections Part 3 Dam Safety Legislation & Regulation July 28, 2012 Presented by Michael Johnson, Ph.D., P.E. Dam Safety Regulations & National Dam Safety
Section 4. Terrestrial Habitats
 Section 4. Terrestrial Habitats Components of Reports... 1226 Definition ranking Key factors Indicators of condition Conservation actions Monitoring Terrestrial Habitat Reports... 1231 Caves, Mines, Sinkholes,
Water Issues Relating to Unconventional Oil and Gas Production
 Water Issues Relating to Unconventional Oil and Gas Production John Veil 410 212 0950 john@veilenvironmental.com www.veilenvironmental.com National Research Council Workshop on the Development of Unconventional
Figure 20. Water table depths as observed (April-October data from Zeigenfuss et al. 2002) and as used in model experiments examining effect of water
 and as used in model experiments examining effect of water") Figure 20. Water table depths as observed (April-October data from Zeigenfuss et al. 2002) and as used in model experiments examining effect of water table depths on willow growth. A) B) C) D ) Figure
Figure 20. Water table depths as observed (April-October data from Zeigenfuss et al. 2002) and as used in model experiments examining effect of water table depths on willow growth. A) B) C) D ) Figure
SHALE FACTS. Production cycle. Ensuring safe and responsible operations
 SHALE FACTS Production cycle Ensuring safe and responsible operations Statoil is committed to developing our shale projects in a safe, responsible and open manner. Statoil takes a long term perspective
Chapter 3 Ecosystem Ecology
 Chapter 3 Ecosystem Ecology Ecosystem Ecology Examines Interactions Between the Living and Non-Living World Ecosystem- A particular location on Earth distinguished by its particular mix of interacting
Saturated Buffer. Subsurface Drainage PURPOSE N REDUCTION LOCATION COST BARRIERS
 Saturated Buffer To intercept tile drainage prior to discharging to surface waters and redistribute the water laterally in the soil profile of the streamside buffer. Subsurface drainage, also known as
The climatic water balance in an ecological context
 Western Mountain Initiative The climatic water balance in an ecological context Nathan L. Stephenson U.S. Department of the Interior U.S. Geological Survey Thesis: Consideration of the climatic water balance
Utilization of the SWAT Model and Remote Sensing to Demonstrate the Effects of Shrub Encroachment on a Small Watershed
 Utilization of the SWAT Model and Remote Sensing to Demonstrate the Effects of Shrub Encroachment on a Small Watershed Jason Afinowicz Department of Biological and Agricultural Engineering Texas A&M University
GIS Analysis of Gully Head Erosion Rates on High Ridge Tree Farm in Winona County, Minnesota
 GIS Analysis of Gully Head Erosion Rates on High Ridge Tree Farm in Winona County, Minnesota Lisa M. Worrell Department of Resource Analysis, Saint Mary s University of Minnesota, Winona, MN 55987. Keywords:
FOREST COMPOSITION CHANGE IN THE EASTERN UNITED STATES
 FOREST COMPOSITION CHANGE IN THE EASTERN UNITED STATES Songlin Fei and Peilin Yang 1 Abstract. Forest ecosystems in the eastern United States are believed to be experiencing a species composition change,
A spatial model to estimate habitat fragmentation and its consequences of long-term survival of animal populations.
 A spatial model to estimate habitat fragmentation and its consequences of long-term survival of animal populations. Abstract Jean-Philippe Aurambout Department of Natural Resources and Environmental Sciences
PREDICTION OF FLOW DURATION CURVES FOR USE IN HYDROPOWER ANALYSIS AT UNGAGED SITES IN POHNPEI, FSM
 PREDICTION OF FLOW DURATION CURVES FOR USE IN HYDROPOWER ANALYSIS AT UNGAGED SITES IN POHNPEI, FSM By Dr. Leroy F. Heitz P.E. Dr. Shahram Khosrowpanah P.E. Technical Report No. 129 July 2010 PREDICTION
The Impacts of Climate Change on Portland s Water Supply
 The Impacts of Climate Change on Portland s Water Supply Richard Palmer and Margaret Hahn University of Washington Department of Civil and Environmental Engineering Joe Dvorak, Dennis Kessler, Azad Mohammadi
APPENDIX D EXTINCTION-DEPTH DETERMINATION
 APPENDIX D EXTINCTION-DEPTH DETERMINATION by Robert Freese SJRWMD 1 Page Intentionally Blank 2 EXTINCTION-DEPTH DETERMINATION Shah et al. (2007) define extinction depth as the depth to water table at which
UTILIZING GEOGRAPHIC INFORMATION SYSTEMS TO IDENTIFY AND MONITOR CONCENTRATED ANIMAL FEEDING OPERATIONS IN DUPLIN COUNTY, NC
 UTILIZING GEOGRAPHIC INFORMATION SYSTEMS TO IDENTIFY AND MONITOR CONCENTRATED ANIMAL FEEDING OPERATIONS IN DUPLIN COUNTY, NC Sean Burke Graduate Student Department of Geography and Geology University of
Applying a Model to Predict the Location of Land Drained by Subsurface Drainage Systems in Central Minnesota
 Applying a Model to Predict the Location of Land Drained by Subsurface Drainage Systems in Central Minnesota Derrick Chip Brown Department of Resource Analysis, Saint Mary s University of Minnesota, Winona,
Ponds. Pond A water impoundment made by excavating a pit, or constructing a dam or an embankment.
 POND SITE SELECTION AND CONSTRUCTION Uses, Planning, & Design David Krietemeyer Area Engineer USDA-NRCS June 20, 2008 Uses Considerations for Location of Commonly Used Terms Pond A water impoundment made
Natural Gas Well Development in the Marcellus Shale: The Use of Fresh Water and Beyond
 Natural Gas Well Development in the Marcellus Shale: The Use of Fresh Water and Beyond Jason de Wolfe, Chief Oil and Gas Q: How much water does the industry use to develop the Marcellus Shale? Each well
Rangeland Conservation Effects Assessment Program (CEAP)
") Rangeland Conservation Effects Assessment Program (CEAP) Program Overview with Emphasis on the Literature Review of Rangeland Practices Pat L. Shaver, PhD Rangeland Management Specialist USDA-NRCS West
Rangeland Conservation Effects Assessment Program (CEAP) Program Overview with Emphasis on the Literature Review of Rangeland Practices Pat L. Shaver, PhD Rangeland Management Specialist USDA-NRCS West
The UNCCD is the custodian agency leading an Inter-Agency Advisory Group on
 SDG indicator 15.3.1 Proportion of land that is degraded over total land area The UNCCD is the custodian agency leading an Inter-Agency Advisory Group on 15.3.1 composed of our key partner FAO as well
West Fork White River Watershed Conservation Map Summaries. Prepared for the Beaver Watershed Alliance. By the Watershed Conservation Resource Center
 West Fork White River Watershed Conservation Map Summaries Prepared for the Beaver Watershed Alliance By the Watershed Conservation Resource Center November 2014 The Watershed Conservation Resource Center
Unsaved Test, Version: 1 1
 Name: Key Concepts Select the term that best completes the statement. A. abiotic B. light C. biotic D. organisms E. ecology F. soil G. ecosystem H. temperature I. factors J. water Date: 1. A(n) is made
R. Srinivasan Prasad Daggupati Deepa Varma
 R. Srinivasan Prasad Daggupati Deepa Varma Outline Development of SWAT model in -Euphrates basin Hydrological analysis of flow in and its tributaries (including river flowing from Iran) feeding to Hawizeh
Chapter 3 Ecosystem Ecology. Tuesday, September 19, 17
 Chapter 3 Ecosystem Ecology Reversing Deforestation in Haiti Answers the following: Why is deforestation in Haiti so common? What the negative impacts of deforestation? Name three actions intended counteract
New Data Show Methane in Pennsylvania Water Wells Unrelated to Hydraulic Fracturing
 New Data Show Methane in Pennsylvania Water Wells Unrelated to Hydraulic Fracturing Lisa Molofsky, John Connor, Shahla Farhat GSI Environmental Inc. Albert S. Wylie, Tom Wagner Cabot Oil and Gas Corporation
2.0 Resource Management Goals of Agencies with Jurisdiction Over the Resource to be Studied
 Study 2.2 WATER BALANCE/OPERATIONS MODEL August 2011 1.0 Project Nexus Yuba County Water Agency s (Licensee or YCWA) continued operation and maintenance (O&M) of the (YRDP or Project) affects storage in
Norman Maclean Snowmelt Flow rate Storm flows fs (c flow m a tre S
 Eventually, all things merge into one, and a river runs through it. Norman Maclean Understanding Streamflow ADEQ SW Short Course June 13, 213 Phoenix, AZ Hydrographs Discharge (Q) USGS flow data & plots
Initial Application of a Landscape Evolution Model to a Louisiana Wetland
 Initial Application of a Landscape Evolution Model to a Louisiana Wetland by Carl F. Cerco PURPOSE: Corps planning projects encompass a wide variety of restoration goals. These include wetland restoration,
CROATIA S SUBMISSION OF INFORMATION ON FOREST MANAGEMENT REFERENCE LEVELS
 CROATIA S SUBMISSION OF INFORMATION ON FOREST MANAGEMENT REFERENCE LEVELS Zagreb, 2011 Contents 1. GENERAL DESCRIPTION... 1 1.1. CONSTRUCTION OF THE FOREST MANAGEMENT REFERENCE LEVEL... 1 1.2. ACCOUNTING
Oregon Spatial Analysis Project
 Oregon Spatial Analysis Project Oregon Department of Forestry June 2006 Table of Contents Executive Summary... 1 Introduction... 3 Background... 3 History of Forest Stewardship and Spatial Analysis Projects...
Paul Ziemkiewicz Joe Donovan West Virginia University Water Research Institute Morgantown WV. West Virginia University Water Research Institute 1
 Paul Ziemkiewicz Joe Donovan West Virginia University Water Research Institute Morgantown WV West Virginia University Water Research Institute 1 West Virginia University Water Research Institute 2 Backstack
Gold Standard Afforestation/Reforestation (A/R) GHG Emissions Reduction & Sequestration Methodology
 GHG Emissions Reduction & Sequestration Methodology") Gold Standard Afforestation/Reforestation (A/R) GHG Emissions Reduction & Sequestration Methodology Version 1 Published July 2017 Table of Contents PREFACE 3 1.0 SCOPE AND APPLICABILITY 4 2.0 METHODOLOGY
Gold Standard Afforestation/Reforestation (A/R) GHG Emissions Reduction & Sequestration Methodology Version 1 Published July 2017 Table of Contents PREFACE 3 1.0 SCOPE AND APPLICABILITY 4 2.0 METHODOLOGY
How would you measure shrub cover here? FOR 274: Forest Measurements and Inventory. Density: What is it?
 How would you measure shrub cover here? Message of the Day: Quadrat & Line Intercept methods are used in multiple disciplines and are all essentially the same FOR 274: Forest Measurements and Inventory
J. Daniel Arthur, P.E., ALL Consulting. Author. Ground Water Protection Council January 2009 San Antonio, Texas. Presented at
 Prudent and Sustainable Water Management and Disposal Alternatives Applicable to Shale Gas Development Author J. Daniel Arthur, P.E., ALL Consulting Presented at Ground Water Protection Council January