The graphs and data for each graph in this report are available for download in a PowerPoint file.
|
|
|
- Emerald Harmon
- 6 years ago
- Views:
Transcription


1 This copy is for archival purposes only. Please contact the publisher for the original version.
2 ACKNOWLEDGEMENTS The following EUB staff contributed to this report. Principal Authors: Reserves Andy Burrowes, Rick Marsh, Nehru Ramdin, Curtis Evans; Supply/Demand and Economics Marie-Anne Kirsch, Monique Brugger, LeMoine Philp, Katherine Elliott, Joanne Stenson, Ken Schuldhaus, Pat Wickel, and Greig Sankey; Editors: Cal Hill, Farhood Rahnama, Carol Crowfoot, and Joseph MacGillivray Data: Debbie Giles, Judy Van Horne; Production: Ona Stonkus, Jackie Bourgaize, Karen Logan, Gail Kelly, Robert de Grace; Communications Advisor: Bob Curran Coordinator: Farhood Rahnama For inquiries regarding reserves, contact Andy Burrowes at (403) For inquiries regarding supply/demand, contact Farhood Rahnama at (403) The graphs and data for each graph in this report are available for download in a PowerPoint file. Download PowerPoint file. Open the PowerPoint file. To access the dataset behind the graph, click on the graph, and a separate window showing the dataset will open. ALBERTA ENERGY AND UTILITIES BOARD ST : Alberta s Energy Reserves 2006 and Supply/Demand Outlook ISSN June 2007 The CD containing the detailed data tables is available for $500 from EUB Information Services (telephone: ; when connected, press 2). CD-ROM ISSN Published by Alberta Energy and Utilities Board Avenue SW Calgary, Alberta T2P 3G4 Telephone: (403) Fax: (403) Web site:
3 EUB ST : Alberta s Energy Reserves 2006 and Supply/Demand Outlook Errata June 15, 2007 The following changes have been incorporated into the print and Web versions of ST : Section Old New Overview, page 10, Figure 7 legend SCO price Bitumen price 2.2.2, page 2-19, first paragraph Table 4.1, page 4-1, change in Initial established reserves
4
5 Contents Overview... 1 Tables Reserves and production summary, Figures 1 Total energy production in Alberta Alberta oil reserves Alberta supply of crude oil and equivalent Total gas production in Alberta Alberta conventional crude oil production and price Alberta mined bitumen production and synthetic crude oil production and price Alberta in situ bitumen production and price Historical natural gas production and price Sulphur closing inventories in Alberta and price Historical coal production and price Energy Prices and Economic Performance Global Oil Market Global Crude Oil Supply Global Crude Oil Reference Price Global Crude Oil Demand North American Energy Prices North American Crude Oil Prices North American Natural Gas Prices Electricity Pool Prices in Alberta Oil and Gas Production Costs in Alberta Canadian Economic Performance Alberta Economic Outlook Tables 1.1 Monthly pool prices and electricity load Alberta median well depths by PSAC area, Major Canadian economic indicators, Major Alberta economic indicators, Value of Alberta energy resource production Figures 1.1 OPEC crude basket reference price Growth in world oil demand Price of WTI at Chicago Average price of oil at Alberta wellhead average monthly reference prices of crudes in Alberta U.S. operating refineries by PADD, Average price of natural gas at plant gate Alberta wholesale electricity prices Alberta well cost estimations by PSAC area Canadian economic indicators Alberta real investment (continued) EUB ST : Alberta s Energy Reserves 2006 and Supply/Demand Outlook / Contents i
6 2 Crude Bitumen Reserves of Crude Bitumen Provincial Summary Initial in-place Volumes of Crude Bitumen Surface-Mineable Crude Bitumen Reserves In Situ Crude Bitumen Reserves Ultimate Potential of Crude Bitumen Ongoing Review of In Situ Resources and Reserves Supply of and Demand for Crude Bitumen Crude Bitumen Production Mined Crude Bitumen In Situ Crude Bitumen Synthetic Crude Oil Production Pipelines Existing Alberta Pipelines Proposed Alberta Pipeline Projects Existing Export Pipelines Proposed Export Pipeline Projects Petroleum Coke Demand for Synthetic Crude Oil and Nonupgraded Bitumen Tables 2.1 In-place volumes and established reserves of crude bitumen Reserve change highlights Initial in-place volumes of crude bitumen Mineable crude bitumen reserves in areas under active development as of December 31, In situ crude bitumen reserves in areas under active development as of December 31, Alberta SCO and nonupgraded bitumen pipelines Export pipelines Figures 2.1 Alberta s oil sands areas Comparison of Alberta s crude oil and crude bitumen reserves Bitumen pay thickness of Athabasca Wabiskaw-McMurray deposit Bitumen pay thickness of Cold Lake Clearwater deposit Reconstructed structure contours of the sub-cretaceous unconformity at the end of Peace River Bluesky time Bitumen pay thickness of Peace River Bluesky-Gething deposit Production of bitumen in Alberta, Alberta crude oil and equivalent production Alberta crude bitumen production Total in situ bitumen production and producing bitumen wells Alberta synthetic crude oil production Alberta SCO and nonupgraded bitumen pipelines Canadian and U.S. crude oil pipelines Alberta oil sands upgrading coke inventory Alberta demand and disposition of crude bitumen and SCO (continued) ii EUB ST : Alberta s Energy Reserves 2006 and Supply/Demand Outlook / Contents
7 3 Crude Oil Reserves of Crude Oil Provincial Summary Reserves Growth Oil Pool Size Pools with Largest Reserve Changes Distribution by Recovery Mechanism Distribution by Geological Formation Ultimate Potential Supply of and Demand for Crude Oil Crude Oil Supply Crude Oil Demand Crude Oil and Equivalent Supply Tables 3.1. Reserve change highlights Breakdown of changes in crude oil initial established reserves Major oil reserve changes, Conventional crude oil reserves by recovery mechanism as of December 31, Figures 3.1 Remaining established reserves of crude oil Annual changes in conventional crude oil reserves Annual changes to waterflood reserves Distribution of oil reserves by size Oil pool size by discovery year Initial established crude oil reserves based on recovery mechanisms Geological distribution of reserves of conventional crude oil Regional distribution of Alberta oil reserves Alberta s remaining established oil reserves versus cumulative production Growth in initial established reserves of crude oil Alberta successful oil well drilling by modified PSAC area Oil wells placed on production, 2006, by modified PSAC area Initial operating day rates of oil wells placed on production, 2006, by modified PSAC area Conventional crude oil production by modified PSAC area Total crude oil production and producing oil wells Crude oil well productivity in Total conventional crude oil production by drilled year Comparison of crude oil production Alberta crude oil price and well activity Alberta daily production of crude oil Capacity and location of Alberta refineries Alberta demand and disposition of crude oil Alberta supply of crude oil and equivalent Alberta crude oil and equivalent production Coalbed Methane Reserves of CBM Provincial Summary Detail of CBM Reserves Commingling of CBM with Conventional Gas (continued) EUB ST : Alberta s Energy Reserves 2006 and Supply/Demand Outlook / Contents iii
8 4.1.4 Distribution of Production by Geologic Strata Hydrogen Sulphide Content Reserves Determination Method Ultimate Potential Supply of and Demand for Coalbed Methane Tables 4.1. Changes in CBM reserves, CBM resources gas-in-place summary constrained potential Figures 4.1 Development entity No.1 Edmonton/Belly River Coalbed methane distribution Coalbed methane well connections by modified PSAC area Coalbed methane production forecast from CBM wells Conventional Natural Gas Reserves of Natural Gas Provincial Summary Annual Change in Marketable Gas Reserves Distribution of Natural Gas Reserves by Pool Size Geological Distribution of Reserves Reserves of Natural Gas Containing Hydrogen Sulphide Reserves of Retrograde Condensate Pools Reserves Accounting Methods Multifield Pools Ultimate Potential Supply of and Demand for Conventional Natural Gas Natural Gas Supply Natural Gas Storage Alberta Natural Gas Demand Tables 5.1 Highlights of marketable gas reserve changes Major natural gas reserve changes, Distribution of natural gas reserves by pool size, Distribution of sweet and sour gas reserves, Distribution of sour gas reserves by H 2 S content, Remaining ultimate potential of marketable gas, Marketable natural gas volumes Production decline rates for new well connections Commercial natural gas storage pools as of December 31, Estimate of gas reserves available for inclusion in permits as at December 31, oil sands average purchased gas use rates Figures 5.1 Annual reserves additions and production of conventional marketable gas Remaining conventional marketable gas reserves New, development, and revisions to conventional marketable gas reserves Conventional marketable gas reserves changes by modified PSAC area Distribution of conventional gas reserves by size Conventional gas pools by size and discovery year Geological distribution of conventional marketable gas reserves (continued) iv EUB ST : Alberta s Energy Reserves 2006 and Supply/Demand Outlook / Contents
9 5.8 Remaining conventional marketable reserves of sweet and sour gas Expected recovery of conventional natural gas components Growth of initial established reserves of conventional marketable gas Conventional gas ultimate potential Regional distribution of Alberta gas reserves Conventional gas in place by geological period Alberta successful gas well drilling (conventional) by modified PSAC area Successful conventional gas wells drilled and connected Conventional gas well connections, 2006, by modified PSAC area Initial operating day rates of connections, 2006, by modified PSAC area Marketable gas production by modified PSAC area Conventional marketable gas production and number of producing gas wells Natural gas well productivity in Raw gas production by connection year Comparison of natural gas production Average initial natural gas well productivity in Alberta Alberta natural gas well activity and price Conventional marketable gas production Gas production from bitumen upgrading and bitumen wells Total gas production in Alberta Alberta natural gas storage injection/withdrawal volumes Commercial gas storage locations Major gas pipelines in Canada and Alberta export points Alberta marketable gas demand by sector Historical volumes available for permitting Purchased natural gas demand for oil sands operations Gas demand for bitumen recovery and upgrading Total purchased process and produced gas for oil sands production Total marketable gas production and demand Natural Gas Liquids Reserves of Natural Gas Liquids Provincial Summary Ethane Other Natural Gas Liquids Ultimate Potential Supply of and Demand for Natural Gas Liquids Supply of Ethane and Other Natural Gas Liquids Demand for Ethane and Other Natural Gas Liquids Tables 6.1 Established reserves and production of extractable NGLs as of December 31, Reserves of NGLs as of December 31, Ethane extraction volumes at gas plants in Alberta, Liquid production at ethane extraction plants in Alberta, 2006 and Figures 6.1 Remaining established NGL reserves expected to be extracted from conventional gas and annual production Remaining established reserves of conventional natural gas liquids Schematic of Alberta NGL flow Ethane supply and demand (continued) EUB ST : Alberta s Energy Reserves 2006 and Supply/Demand Outlook / Contents v
10 6.5 Propane supply from natural gas and demand Butanes supply from natural gas and demand Pentanes supply from natural gas and demand for diluent Sulphur Reserves of Sulphur Provincial Summary Sulphur from Natural Gas Sulphur from Crude Bitumen Sulphur from Crude Bitumen Reserves Under Active Development Supply of and Demand for Sulphur Sulphur Supply Sulphur Demand Tables 7.1 Reserves of sulphur as of December 31, Remaining established reserves of sulphur from natural gas as of December 31, Figures 7.1 Sources of sulphur production Sulphur production from gas processing plants in Alberta Sulphur production from oil sands Canadian sulphur offshore exports Sulphur supply and demand in Alberta Coal Reserves of Coal Provincial Summary Initial in-place Resources Established Reserves Ultimate Potential Supply of and Demand for Marketable Coal Coal Supply Coal Demand Tables 8.1 Established initial in-place resources and remaining reserves of raw coal in Alberta as of December 31, Established resources and reserves of raw coal under active development as of December 31, Ultimate in-place resources and ultimate potentials Alberta coal mines and marketable coal production in Figures 8.1 Total coal production Producing coal mines in Alberta Alberta marketable coal production Electricity Electricity Generating Capacity Provincial Summary Electricity Generating Capacity by Fuel (continued) vi EUB ST : Alberta s Energy Reserves 2006 and Supply/Demand Outlook / Contents
11 9.2 Supply and Demand of Electricity Electricity Generation Electricity Transfers Electricity Demand in Alberta Imbalances Between Electricity Supply and Demand Oil Sands Electricity Supply and Demand Regional Electricity Supply and Demand Tables 9.1 Proposed electricity generating capacity additions, Figures 9.1 Alberta electricity generating capacity Alberta electricity generation Alberta electricity transfers Alberta electricity consumption by sector Alberta oil sands electricity generation and demand Electricity generation and demand by region Appendix A Terminology, Abbreviations, and Conversion Factors... A1 1.1 Terminology... A1 1.2 Abbreviations... A8 1.3 Symbols... A9 1.4 Conversion Factors... A9 Appendix B Summary of Crude Bitumen, Conventional Crude Oil, Coalbed Methane, and Natural Gas Reserves... A11 B.1 Initial in-place resources of crude bitumen by deposit... A11 B.2 Basic data of crude bitumen deposits... A12 B.3 Conventional crude oil reserves as of each year-end... A17 B.4 Conventional crude oil reserves by geological period as of December 31, A18 B.5 Distribution of conventional crude oil reserves by formation as of December 31, A19 B.6 Upper Cretaceous and Mannville CBM in-place and established reserves, 2006, deposit block model method... A20 B.7 Noncommercial CBM production, 2006, production extrapolation method other CBM areas... A22 B.8 Summary of marketable natural gas reserves as of each year-end... A23 B.9 Geological distribution of established natural gas reserves, A24 B.10 Natural gas reserves of retrograde pools, A25 B.11 Natural gas reserves of multifield pools, A27 B.12 Remaining raw ethane reserves as of December 31, A30 B.13 Remaining established reserves of natural gas liquids as of December 31, A32 Appendix C CD Basic Data Tables... A35 Appendix D Drilling Activity in Alberta... A41 D.1 Development and exploratory wells, , number drilled annually... A41 D.2 Development and exploratory wells, , kilometres drilled annually... A42 EUB ST : Alberta s Energy Reserves 2006 and Supply/Demand Outlook / Contents vii
12
13 Overview The Alberta Energy and Utilities Board (EUB) is an independent, quasi-judicial agency of the Government of Alberta. Its mission is to ensure that the discovery, development, and delivery of Alberta s energy resources and utilities services take place in a manner that is fair, responsible, and in the public interest. As part of its legislated mandate, the EUB provides for the appraisal of the reserves and their productive capacity and the requirements for energy resources and energy in Alberta. Providing information to support good decision-making is a key service of the EUB. Making energy resource data available to everyone involved the EUB, landowners, communities, industry, government, and interested groups results in better decisions that affect the development of Alberta s resources. Every year the EUB issues a report providing stakeholders with one of the most reliable sources of information on the state of reserves, supply, and demand for Alberta s diverse energy resources crude bitumen, crude oil, natural gas, natural gas liquids, coal, and sulphur. This year s Alberta Energy Reserves 2006 and Supply/Demand Outlook includes estimates of initial reserves, remaining established reserves (reserves we know we have), and ultimate potential (includes reserves that have already been discovered plus those that have yet to be discovered). It also includes a 10-year supply and demand forecast for Alberta s energy resources. In this year s report, the EUB has added a new section on Alberta s electricity outlook. As well, some historical trends on selected commodities are provided for better understanding of supply and price relationships. Energy Prices and Alberta s Economy For world energy markets, 2006 will be remembered as a year dominated by geopolitics and the inventory fluctuation in the United States, the world s largest oil-consuming nation. A major decline in Nigeria s production due to political unrest and the escalation of tension in the Middle East due to the war between Israel and Lebanon during the summer months were among the geopolitical events in These factors caused world crude oil prices to skyrocket to their highest levels yet. In the Unites States, warmer-thanusual weather and a calm hurricane season allowed crude oil inventories to increase and eased the tension in the market. As a result, crude oil prices dropped during the last quarter of the year. The growth in world oil demand also slowed, as demand in the United States, Europe, and some Pacific countries declined. World oil supply grew more than demand, leading to somewhat larger spare capacity in the Organization of Petroleum Exporting Countries (OPEC), particularly Saudi Arabia. The EUB is basing its analysis on the expectations that the crude oil price in North America, measured by West Texas Intermediate (WTI) crude oil, will average US$62 per barrel in 2007 and rise steadily to an average of US$69 per barrel by North American natural gas prices and drilling activity were also impacted by warmerthan-usual weather in Natural gas storage levels in North America remained well above their five-year average. As a result, natural gas prices declined compared with The Alberta price of natural gas at the plant gate is expected to average Cdn$7.25 per gigajoule in 2007 and then rise steadily to Cdn$8.35 per gigajoule by EUB ST : Alberta s Energy Reserves 2006 and Supply/Demand Outlook / Overview 1


14 Energy Production in Alberta While this report focuses on the fossil-based energy resources in the province, a relatively small amount of energy is also produced from renewable energy sources. In 2006, Alberta produced petajoules of energy from all sources, including renewable sources such as hydro and wind power. This is equivalent to 5.1 million barrels per day of conventional light- and medium-quality crude oil. A breakdown of production by these energy sources is illustrated in Figure 1. The remainder of this report focuses on nonrenewable energy resources. This section provides an overview of the reserves and production from these sources. Raw bitumen in Alberta is produced either by mining the ore or by various in situ techniques using wells to extract bitumen. Raw bitumen production surpassed conventional crude oil production in 2001 for the first time. Production of bitumen has continued its growth, accounting for 70 per cent of Alberta s total crude oil and raw bitumen production in The value-added process of upgrading raw bitumen to synthetic crude oil (SCO) was expanded in Bitumen production at in situ projects increased by 13 per cent in 2006, while production at mining projects increased by 21 per cent. As a result, overall raw bitumen production increased by some 18 per cent compared with Conventional natural gas production in Alberta held onto 2005 levels in The EUB has concluded that natural gas production in the province peaked in Natural gas production in 2007 is expected to decline by 2.2 per cent compared with High levels of drilling in the past four years have prevented a sharp decline in production. 1 The upgrading process produces a variety of lighter products that are collectively referred to as SCO in this report. Naphtha, diesel fuel, and a crude similar to light crude oil in quality are the common products in the upgrading process. 2 EUB ST : Alberta s Energy Reserves 2006 and Supply/Demand Outlook / Overview
15 Gas production from coalbed methane (CBM) development activity continued to increase in CBM wells produced 0.17 trillion cubic feet (tcf) of commingled natural gas, an increase of 62 per cent over CBM contributed 3.4 per cent of the provincial total natural gas production. The EUB anticipates that CBM development activity will continue to increase. The growing amount of information available from high CBM drilling activity has led EUB estimates of established CBM reserves to increase compared with last year. The following table summarizes Alberta s energy reserves at the end of Reserves and production summary, 2006 Crude bitumen Crude oil Natural gas a Raw coal (million cubic (billion (million cubic (billion (billion cubic (trillion cubic (billion (billion metres) barrels) metres) barrels) metres) feet) tonnes) tons) Initial in place Initial established Cumulative production Remaining established b 40.5 b Annual production Ultimate potential (recoverable) c 223 c a Includes CBM, except for Initial in place with no estimate at this time. Expressed as as is gas. b Measured at field gate (or 38 trillion cubic feet downstream of straddle plant). c Does not include CBM. Crude Bitumen and Crude Oil Crude Bitumen Reserves The total in situ and mineable remaining established reserves for crude bitumen are 27.5 billion cubic metres (m 3 ) (173 billion barrels), which is slightly less than 2005 due to production. Only 3.0 per cent of the initial established crude bitumen reserves have been produced since commercial production started in Crude Bitumen Production In 2006, Alberta produced 44.1 million m 3 (278 million barrels) from the mineable area and 28.7 million m 3 (180 million barrels) from the in situ area, totalling 72.8 million m 3 (458 million barrels). This is equivalent to199 thousand m 3 /day (1.25 million barrels per day). Bitumen produced from mining was upgraded, yielding 38.1 million m 3 (240 million barrels) of SCO. In situ production was mainly marketed as nonupgraded crude bitumen. Crude Oil Reserves Alberta s remaining established reserves of conventional crude oil was estimated at 250 million m 3 (1.6 billion barrels), a 2 per cent decrease from Of the 27.1 million m 3 (171 million barrels) added to the initial established reserves, 24.9 million m 3 (157 million barrels) was due to exploratory and development drilling, as well as new enhanced recovery schemes. This replaced 79 per cent of the 2006 production. Positive revisions accounted for the remaining 2.2 million m 3 (14 million barrels). EUB ST : Alberta s Energy Reserves 2006 and Supply/Demand Outlook / Overview 3

 in 2006. This equates to 86 400 m 3 /day (543 700 barrels/day).")
16 Based on its 1988 study, the EUB estimates the ultimate potential recoverable reserves of crude oil at 3130 million m 3 (19.7 billion barrels). The EUB believes that this estimate of ultimate potential is still reasonable. Future improvements in technology could improve the current average recovery efficiency of 26 per cent. Annual production and remaining established reserves for crude bitumen and crude oil are presented in Figure 2. Crude Oil Production and Drilling Alberta s production of conventional crude oil totalled 31.5 million m 3 (198 million barrels) in This equates to m 3 /day ( barrels/day). The number of oil wells placed on production increased by 4 per cent to 1956 in 2006 from 1881 in With the expectation that crude oil prices will remain strong, the EUB estimates that the number of new wells placed on production will increase to 2000 wells in 2007 and remain at this level over the forecast period. Total Oil Supply and Demand Alberta s 2006 production from conventional oil, oil sands, and pentanes plus was m 3 /day (1.82 million barrels/day), a 7 per cent increase compared with Production is forecast to reach m 3 /day (3.2 million barrels/day) by A comparison of conventional oil and bitumen production, as illustrated in Figure 3, over the last 10 years clearly shows the increasing contribution of bitumen to Alberta s oil production. This ability to shift from conventional oil to bitumen is unique to Alberta, allowing the province to offset the continued decline in conventional oil with bitumen production. 4 EUB ST : Alberta s Energy Reserves 2006 and Supply/Demand Outlook / Overview


17 The EUB estimates that bitumen production will more than double by The share of nonupgraded bitumen and SCO production in the overall Alberta crude oil and equivalent supply is expected to increase from 62 per cent in 2006 to 86 per cent by Natural Gas Natural gas is produced from two main sources in Alberta at this time. While natural gas production from conventional sources accounts for the majority, natural gas production from coal, CBM, has grown rapidly in the past few years. Natural gas production from other sources, such as shale gas, may prove to be an additional source in the near future. Coalbed Methane Reserves CBM has been recognized as a commercial supply of natural gas in Alberta for only the past few years. Activity in CBM has increased dramatically from a few test wells in 2001 to over 6000 wells connected to pipelines in The growth in CBM data collection and gas production has increased confidence in publication of CBM reserves estimates, despite continuing uncertainty in recovery factors and production accounting. At the end of 2006, the remaining established reserves of CBM in Alberta is estimated to be 24.7 billion m 3 (877 billion cubic feet). This is limited mainly to the dry CBM trend of central Alberta, as other CBM resource development has currently shown commercial producibility in only two fields. Conventional Natural Gas Reserves At the end of 2006, Alberta s remaining established reserves of natural gas stood at 1115 billion m 3 (40 tcf) at the field gate. This reserve includes some liquids that are subsequently removed at straddle plants. Reserves from new drilling replaced 68 per cent of production in This compares with 63 per cent replacement in EUB ST : Alberta s Energy Reserves 2006 and Supply/Demand Outlook / Overview 5
18 In March 2005, the EUB and the National Energy Board (NEB) jointly released Report 2005-A: Alberta s Ultimate Potential for Conventional Natural Gas, an updated estimate of the ultimate potential for conventional natural gas. The Boards adopted the medium case, representing an ultimate potential of 6276 billion m 3, or 223 tcf (6528 billion m 3, or 232 tcf, at 37.4 megajoules per m 3 ). The estimate, which does not include unconventional gas, such as CBM, updates the 5600 billion m 3 stated in the Energy Resources Conservation Board (now EUB) Report 92-A: Ultimate Potential and Supply of Natural Gas in Alberta. The primary reason for this increase is a better understanding of the geology of the province as a result of significant increased drilling since Natural Gas Production and Drilling Several major factors have an impact on natural gas production, including natural gas prices, drilling activity, the accessibility of Alberta s remaining reserves, and the performance characteristics of wells. Alberta produced billion m 3 (4.9 tcf) of marketable natural gas in 2006, of which 1.2 billion m 3 (0.04 tcf) was CBM. There were successful conventional natural gas wells drilled in Alberta in 2006, a 9 per cent decrease from the gas wells drilled in The EUB expects strong drilling over the forecast period, estimating successful wells in 2007, and increasing to successful wells per year thereafter. Much of Alberta s gas development has centred on shallow gas in southeastern Alberta, which contains over half of the province s producing gas wells but only 20 per cent of the 2006 natural gas production. The EUB anticipates that shallow drilling will continue to account for a large share of the activity in the province over the next few years. CBM production in the province is forecast to supplement the supply of conventional natural gas. There were 2434 successful CBM well connections in Alberta in The EUB expects CBM well drilling to decline in 2007 to 1900 wells. The commodity price declines that took place in late 2006 are responsible for a slowdown in CBM and shallow conventional gas drilling, which is expected to continue well into In 2008 and 2009, some 2400 wells are forecast to be connected annually, increasing to 2500 wells in 2010 and thereafter for the remainder of the forecast period. Natural Gas Supply and Demand The EUB expects conventional gas production to decline by an average of 2.5 per cent per year over the forecast period. New pools are smaller, and new wells drilled today are exhibiting lower initial production rates and steeper decline rates. Factoring this in, the EUB believes that new wells drilled will not be able to sustain production levels over the forecast period. CBM production commingled with conventional gas is forecast to supplement the supply of conventional gas in the province. It is expected to increase from 4.7 billion m 3 in 2006 to 16.8 billion m 3 in Although natural gas supply from conventional sources is declining, sufficient supply exists to easily meet Alberta s demand. If the EUB s demand forecast is realized, Alberta s natural gas requirement will be 44 per cent of total Alberta production by the end of the forecast period. As Alberta requirements increase and production declines over time, the volumes available for removal from the province will decline. The EUB s mandate requires that the natural gas requirements for Alberta s core market (defined as residential, commercial, and institutional gas consumers) are met over the long term before any new 6 EUB ST : Alberta s Energy Reserves 2006 and Supply/Demand Outlook / Overview
19 gas removal permits are approved. Figure 4 depicts Alberta s marketable gas production and disposition. Ethane, Other Natural Gas Liquids, and Sulphur Remaining established reserves of extractable ethane is estimated at 125 million m 3 (787 million barrels) as of year-end This estimate considers the ethane recovery from raw gas based on existing technology and market conditions. In 2006, the production of specification ethane increased slightly to 40.6 thousand m 3 /day (255 thousand barrels/day) from the 2005 level of 40.1 thousand m 3 /day (252 thousand barrels/day). The majority of ethane was used as feedstock for Alberta s petrochemical industry. The supply of ethane is expected to meet demand over the forecast period. The remaining established reserves of other natural gas liquids (NGLs) propane, butanes, and pentanes plus increased to 171 million m 3 (1.1 billion barrels) in The supply of propane and butanes is expected to meet demand over the forecast period. However, a shortage of pentanes plus as a diluent for heavy oil and nonupgraded bitumen is expected by Alternative sources of diluent will be required. The remaining established reserves of sulphur increased in 2006 by 70 million tonnes to 159 million tonnes. Sulphur is recovered from the processing of natural gas and upgrading of bitumen from mining areas under active development. Sulphur demand is expected to remain at 2006 levels, and Alberta s sulphur inventory is expected to grow over the forecast period. EUB ST : Alberta s Energy Reserves 2006 and Supply/Demand Outlook / Overview 7
20 Coal Electricity Energy Trends The current estimate for remaining established reserves of all types of coal is about 34 billion tonnes (37 billion tons). Most of this massive energy resource continues to help meet the energy needs of Albertans, supplying fuel for about 63 per cent of the province s electricity generation in Alberta s total coal production in 2006 was 32.5 million tonnes of marketable coal, most of which was subbituminous coal destined for mine mouth power plants. Alberta s coal reserves represent over a thousand years of supply at current production levels. Subbituminous coal production is expected to increase over the forecast period to meet demand for additional domestic electrical generating capacity. The small portion of Alberta coal production that was exported from the province can be separated into thermal coal exports and metallurgical coal exports. Due to continued high oil prices, there has been improved economics in the coal markets, and hence thermal coal production at the Coal Valley mine more than doubled in Electricity generating capacity within Alberta totalled megawatts (MW) in The decommissioning of units at the Cloverbar natural gas-fired generating station, increases to natural gas-fired generation capacity at Syncrude s oil sands operation, and the commissioning of new wind turbines resulted in a net decrease to capacity of 330 MW compared to Over the next 10 years, as much as 3550 MW of capacity may be added to the power grid. Total capacity could reach MW by In 2006, the total electricity generated within Alberta reached gigawatt hours (GWh), an increase of nearly 4 per cent from Alberta s net imports of electricity were 1214 GWh in Total imports were comparable to 2005 at 1704 GWh, but exports decreased by 53 per cent to 490 GWh. Over the forecast period, electricity generation is expected to grow by an average of 4 per cent per year, or a total of 25 terawatt hours. As electricity demand is expected to grow at roughly the same rate as supply, the electricity market will continue to exhibit a tightness that will result in elevated electricity prices comparable to the 2006 average. In Alberta, total electricity demand (retail sales and industrial on-site use) in Alberta increased 4 per cent from Growth in industrial electricity demand, through both retail sales and on-site generation, was between 3 and 4 per cent. Electricity demand in the oil sands sector grew by 23 per cent in 2006, accounting for 19 per cent of total industrial demand. Crude Oil and Bitumen Alberta s historical conventional crude oil production and the average Alberta wellhead price are shown in Figure 5. Production from the Turner Valley field, first discovered in 1914, accounted for 99 per cent of production in 1938 and 89 per cent of production in The discovery of Leduc Woodbend in 1947 jumpstarted Alberta crude oil production, which culminated in 1973 with peak production of thousand m 3 /day. Major events that affected Alberta s crude oil production and crude oil prices are also noted on the figure. Factors affecting current crude oil prices and the forecast are found in Section 1: Economics. 8 EUB ST : Alberta s Energy Reserves 2006 and Supply/Demand Outlook / Overview
 in 1967.")
 in 2003.")

21 Figure 6 shows the historical mined bitumen and SCO production commencing with the start-up of Great Canadian Oil Sands (Suncor) in This was followed by Syncrude in 1978 and the Alberta Oils Sands Project (Albian Sands and Shell Scotford Upgrader) in Also shown in the figure is the price of SCO from The price of SCO generally runs at a premium to light crude oil. EUB ST : Alberta s Energy Reserves 2006 and Supply/Demand Outlook / Overview 9

22 Historical production and price of in situ bitumen are shown in Figure 7. Imperial s Cold Lake, which uses the cyclic steam stimulation recovery method, has historically accounted for the major portion of in situ production. The price of bitumen generally follows the light crude oil price but at a discount of between 50 and 60 per cent. Natural Gas Natural gas as a commodity has an interesting past, as seen in Figure 8, which shows historical gas production and price. In the 1950s and 1960s it was mainly produced as a by-product of crude oil production and was flared as a waste product. During this period, natural gas prices were low. In the early 1970s, when OPEC increased crude oil prices, western Canadian producers started asking for higher prices. The federal government at the time objected to higher gas prices, as it believed that would have a negative impact on the Canadian economy. The disagreements were resolved through arbitration and natural gas prices started to increase. In 1980, through the National Energy Program, the federal government imposed regulated gas prices tied to crude oil prices based on their relative calorific values. High gas prices in the 1980s brought on a vibrant gas industry, which resulted in a significant oversupply of reserves. In 1985, natural gas prices were deregulated in Canada. The removal of set prices, the oversupply of reserves, and the drop in demand due to recession resulted in the decline of natural gas prices for the rest of the decade. In the early 1990s natural gas prices became more market responsive. Development of trading points in Chicago, New York, and the Henry Hub in the United States in the late 1980s and AECO C in the early 1990s facilitated natural gas being traded as a true commodity. The development of new export pipelines and expansions to existing pipelines to the United States has allowed Alberta gas to be fully integrated into the North American gas marketplace. 10 EUB ST : Alberta s Energy Reserves 2006 and Supply/Demand Outlook / Overview


23 Sulphur Figure 9 illustrates sulphur closing inventories at processing plants and oil sands operations from 1971 to Sulphur prices in this period are also shown, adding insight into understanding how prices affect the growth or decline in sulphur inventories. Because of the logistics costs, Canadian sulphur producers do not remelt and remove inventories unless they are assured a good price. When international demand is high EUB ST : Alberta s Energy Reserves 2006 and Supply/Demand Outlook / Overview 11


24 and international prices follow, Alberta remelts block and adds to the supply. This is usually sufficient to bring things back into balance, reduce prices, and stop the remelting of inventories. The cycle has been repeated several times in the last 35 years. Figure 9 depicts the trends in Alberta sulphur market. Coal The price for coal, as indicated in Figure 10, is based on thermal coal contract prices for Australian coal shipped to Japan (often referred to as Newcastle thermal coal) and is used as a benchmark in this report. Australia is the world s largest exporter of coal. 12 EUB ST : Alberta s Energy Reserves 2006 and Supply/Demand Outlook / Overview
25 1 Energy Prices and Economic Performance This section discusses major forecast assumptions that affect Alberta s energy supply and demand. Energy production is generally affected by energy prices, demand, and other factors. Energy demand, in turn, is determined by such factors as economic activity, standard of living, seasonal temperatures, and population. Furthermore, the activity in Alberta s energy sector is heavily influenced by demand and supply conditions and economic activity in the United States, the largest importer of Alberta s fossil fuels. This section introduces some of the main variables impacting energy requirements and sets the stage for supply and demand discussions in the report. Alberta crude oil prices are determined globally and relate to West Texas Intermediate (WTI) and the Organization of Petroleum Exporting Countries (OPEC) reference basket price. The section begins with a discussion of the current global oil demand and supply picture, with projections for 2007 and 2008 based on research conducted by the International Energy Agency (IEA). A review of the OPEC crude oil basket reference price and summary of factors that will play a key role in influencing benchmark oil prices in the years to come are included. A discussion of North American energy prices is presented, including natural gas and electricity. The section concludes with a summary of Canada s recent economic performance, along with the EUB s outlook on Alberta s economic growth. 1.1 Global Oil Market For world energy markets, 2006 will be remembered as a year dominated by geopolitics and the inventory situation in the United States, the world s largest oil-consuming nation Global Crude Oil Supply Following severe supply shocks of oil, natural gas, and gasoline production from the U.S. Gulf of Mexico in the third and fourth quarters of 2005, stocks of those products were quickly rebuilt in early By March 2006, crude oil stocks in the United States reached a record 16 per cent above their five-year average. Furthermore, distillate stocks (including diesel fuels and gasoline) were well above five-year averages heading into the automobile driving season. Hurricanes Katrina and Rita caused damage to refineries, pipelines, and storage in the U.S. Gulf Coast, and for months the United States was forced to draw on crude from its Strategic Petroleum Reserve (SPR). Additions to the SPR stopped in May after some of the strategic inventory was rebuilt. Given the good supply situation in the first two quarters of the year and the relatively low demand that came about due to a relatively warm winter and spring, prices of crude oil and petroleum products should have been falling from their record highs in Instead, geopolitics once again took centre stage. Political unrest during the spring in Nigeria, Africa s largest oil producer, and one of OPEC s largest exporters caused output in that country to fall by a quarter of its normal production levels. EUB ST : Alberta s Energy Reserves 2006 and Supply/Demand Outlook / Economics 1-1


26 1.1.2 Global Crude Oil Reference Price The political events noted above caused significant upheaval in world energy markets, and the OPEC reference price of crude oil jumped well beyond US$60 per barrel in April, remaining there for a number of months. Tensions between Israel and Lebanon escalated to war in July. Although neither of these countries has significant oil producing or exporting capacity, traders were worried that the conflict spreading through the Middle East had the potential to cause production, transportation, and export disruptions. By the last half of July and first half of August, the OPEC reference price rose even further, averaging US$68.89 per barrel in July and US$68.81 per barrel in August. These were record average monthly prices since trading began in the early 1970s. Soon after the conflict between Israel and Lebanon subsided and the forecast of a devastating hurricane season in the United States did not materialize, world crude oil prices tumbled. OPEC was then quick to announce production cuts to quotas totalling 1.7 million barrels per day (bbl/d) to take place between November 2006 and February This first production cut announced by OPEC since April 2004 helped to prop up prices in December. OPEC has stated that it would like to keep its reference price between US$55 and US$60 per barrel. Maintaining such a level will depend largely on the demand situation in the United States and its effect on inventories as the driving season commences and another hurricane season gets under way. Figure 1.1 depicts the monthly average OPEC crude oil basket reference price for OPEC adopted a new reference crude oil basket on June 15, 2005, consisting of eleven crude oils. It is a better reflection of the average quality of the main crudes exported from OPEC member countries. 1-2 EUB ST : Alberta s Energy Reserves 2006 and Supply / Demand Outlook / Economics
27 The original OPEC reference basket consisted of seven crude oils, including Saudi Arabia Arab Light, Nigeria Bonny Light, Dubai Fateh, Mexico Isthmus (non-opec), Indonesia Minas, Algeria Saharan Blend, and Venezuela Tia Juana (T.J. Light). The new OPEC reference basket consists of Arab Light, Bonny Light, Minas, and Saharan Blend, plus Iran Heavy, Iraq Basra Light, Kuwait Export, Libya Es Sider, Qatar Marine, United Arab Emirates Murban, and Venezuela BCF 17. The new OPEC reference crude is heavier, with an American Petroleum Institute (API) gravity of 32.7, compared to 34.6 for the previous basket. It is also more sour, with an average sulphur content of 1.77 per cent, compared to a previous average sulphur content of 1.44 per cent. When it was adopted in June 2005, the original OPEC reference price averaged US$52.72 per barrel for the month, while the new OPEC reference price averaged US$50.92 per barrel. The move to this new OPEC crude oil basket is a reflection of average crude quality. The member countries are producing from reservoirs with heavier and more sour crudes to augment the rapidly declining production from the higher quality reservoirs. In 2006, the OPEC reference price averaged US$61.08 per barrel, a 20.6 per cent yearover-year increase from During the last quarter of 2006, OPEC suggested that crude oil supplies were in excess to demand and caused destabilization to the market. OPEC subsequently reacted by announcing a number of cuts to production to balance supply and demand. OPEC production (including Iraq) averaged 29.6 million bbl/d in 2006, but production was cut to 25.8 million bbl/d effective February 1, At its meeting in March 2007, OPEC stated that it is unlikely to cut quotas any further as long as current prices hold. These quota cuts mean that spare capacity will grow and provide more of a cushion for the markets. OPEC has the potential to produce about 30.2 million bbl/d of crude oil, excluding production from Angola and Iraq. Angola joined OPEC in January 2007; with Angola and Iraq production, OPEC capacity is estimated at 34.2 million bbl/d. With a better cushion of spare capacity, large fluctuations in the OPEC reference price could be minimized. OPEC members still have a number of issues that the markets will be wary of: Venezuela nationalizing its energy industry, the threat of continued militant attacks in upstream oil infrastructure in Nigeria, and the potential for conflict to erupt between Iran and the United States. With the continuing conflict in Iraq, it is unlikely that its oil production potential will be reached in the short term. Venezuela, Nigeria, Iran, and Iraq accounted for 10.6 million bbl/d, or 36 per cent, of OPEC s crude oil production in Global Crude Oil Demand In the short run, the price of oil is inelastic, meaning reduced production or increased consumption will provoke an immediate response of sending oil prices higher. High energy prices, however, can create a drag on economic growth, especially for major oil importers whose currencies depreciate, making it more costly to import other goods and services, which may result in slower growth in the global demand for crude oil. Growth in global oil demand slowed somewhat in 2006, from 1.3 to 0.8 million bbl/d. China s economy is still very strong, and its oil demand increased by 7 per cent in Chinese demand is expected to grow by 0.5 million bbl/d in 2007, as China s economy continues to post economic growth of between 7 and 10 per cent per year in the short term. Economic growth, in particular that of Asia, will play a key role in the continued strength of crude oil prices going forward. In both the Middle East and India, oil demand is EUB ST : Alberta s Energy Reserves 2006 and Supply/Demand Outlook / Economics 1-3


28 growing at a good pace and will continue to do so over the short term. India s economic growth may rival that of China s in future years, while only some of the economies of the Middle East have robust outlooks. Demand weakness was most evident in the United States and Europe in In the United States demand averaged 20.7 million bbl/d for 2006, 0.1 million bbl/d less than in Milder weather, ample storage, and weaker economic growth all contributed to the drop in oil demand. Demand is expected to grow by 0.4 million bbl/d in Economic growth in the United States is expected to remain moderate in 2007, as the economy makes a soft landing following the deceleration that began in Some analysts believe the uncertainty in the U.S. housing market, inflationary pressures, and low employment gains may have passed. In Europe, crude oil demand remained stagnant at 16.2 million bbl/d in 2006 and is expected to remain at that level for Total world oil demand reached 84.3 million bbl/d in 2006, up 0.9 per cent or 0.8 million bbl/d from Demand is expected to grow by 1.8 per cent, or almost 1.5 million bbl/d in Figure 1.2 illustrates growth in oil demand across the globe between 2005 and Global oil supply exceeded demand in 2006 by an estimated 0.9 million bbl/d, but this had little effect on stabilizing prices. Supply reached 85.2 million bbl/d, with 29.7 million bbl/d of crude being produced by OPEC members, a share of 35 per cent. OPEC members are expected to supply an increasingly larger share of crude oil, as significant investment is going into oil production in countries such as Saudi Arabia. Supply from non-opec countries has fallen off in recent years, as it is becoming increasingly difficult and expensive to find and produce large sources of crude. With more crude oil originating from politically unstable nations in the short to medium term, the OPEC reference price of oil is expected to remain well above US$50 per barrel. 1-4 EUB ST : Alberta s Energy Reserves 2006 and Supply / Demand Outlook / Economics
29 The EUB expects an average growth rate for global demand for crude oil to be in the 1 per cent range over the forecast period. However, it is expected that fluctuations will occur around this average rate within this time period. 1.2 North American Energy Prices North American Crude Oil Prices North American crude oil prices are determined by international market forces and are most directly related to the reference price of WTI. WTI is a reference crude with an API of 40 and sulphur content of less than 0.5 per cent. The WTI crude oil price is set in Chicago and ranges between US$6 to $7 higher than the OPEC reference price, reflecting quality differences and the cost of shipping to the Chicago market. The EUB uses the WTI crude price as its benchmark for world oil prices, as Alberta crude oil reference prices are based on WTI netbacks to the Alberta wellhead. Netbacks are calculated from the price of WTI at Chicago less transportation and other charges from the wellhead to Chicago and are adjusted for the exchange rate, as well as crude quality. Edmonton Par is priced at an API of 40 with a sulphur content of 0.5 per cent. The WTI price of crude oil was influenced by many of the same factors affecting the OPEC reference price during Following the supply shocks of the second half of 2005, when an active hurricane season caused a substantial reduction in oil production and refining capacity in the U.S. Gulf Coast, the WTI price of oil surpassed US$60 per barrel. Political risk surrounding Nigeria and Venezuela, combined with escalating civil violence in Iraq, caused WTI spot price at Cushing, Oklahoma, to hit a daily record US$74.62 in May. A warm winter decreased heating demand from its normal level and caused inventories of crude oil and products to swell well beyond five-year averages; however, this did little to deflate prices. With the events of the 2005 hurricane season still fresh in the minds of traders, markets became wary of the ensuing hurricane season. The probable risk of a second consecutive destructive hurricane season was quickly priced into WTI in the early spring of Ironically, the 2006 hurricane season started late in the summer and barely made the headlines. Inventories of crude oil and most petroleum products grew accordingly. This also gave refineries on the U.S. Gulf Coast a chance to complete repair work necessitated by the 2005 hurricane season. With bulging inventories, docile weather, and low demand growth caused by a decelerating U.S. economy, oil prices should have been falling quickly. Once again, in mid July geopolitics overwhelmed the stable demand-supply conditions due to the Israel-Lebanon conflict. Hence WTI averaged US$75.70 in July and US$74.31 in August. Another daily record spot price of US$76.29 was reached on August 8. From mid-august, WTI fell significantly, but it still exhibited wide daily swings. From September to the end of 2006, supply and demand fundamentals were successful at influencing prices. The key heating oil consuming regions of North America experienced a mild autumn and beginning to the winter season, which allowed inventories of crude oil and products to be built even more and to remain at record levels. The WTI price of oil sank quickly and approached US$50 per barrel in January The EUB expects WTI to range between US$55 and US$69 per barrel, with an average price of US$62 per barrel for The forecast range is lower than last year s and is indicative of the expectations for crude supply and demand in the United States, as well EUB ST : Alberta s Energy Reserves 2006 and Supply/Demand Outlook / Economics 1-5


30 as shrinkage in the risk premium set by geopolitical tensions. Over the longer term, the top end of the range assumes a nominal average annual growth rate of 3 per cent. This rate takes into account a 1 per cent growth in global crude demand and an average annual inflation rate of 2 per cent. The bottom end of the price range of WTI is an extension of the current average lows experienced in the market. Most of the risks to this forecast are upward and include a longer than expected heating season, which could reduce the inventories, more demand than anticipated for gasoline during the driving season, a particularly active hurricane season, further cuts to OPEC quotas, and renewed geopolitical upheavals. Downside risks include lower than anticipated economic performance in the United States, which could quell oil demand. Weak economic performance in the United States could impact the global economy and further weaken demand for oil. Figure 1.3 illustrates the EUB forecast of WTI at Chicago. Figure 1.4 shows the forecast for the wellhead price of crude oil in Alberta based on WTI netbacks from Chicago. Figure 1.5 illustrates the monthly average price of Alberta light-medium crude, heavy crude, and neat bitumen. In 2006, heavy crude and bitumen prices averaged Cdn$46.36 and Cdn$40.53 per barrel respectively, while the Alberta light-medium reference price averaged Cdn$68.16 per barrel. In 2004 and 2005, the heavy/light differential widened as light crude prices increased at a faster pace than heavy crude. However, in 2006 the opposite occurred, and the price of heavier crudes in Alberta increased at a faster rate relative to light and medium crude, leading to a narrowing of the premium of heavy versus light from 60 per cent to 68 per cent. Similarly, the bitumen/light-medium differential narrowed from 47 to 59 per cent. 1-6 EUB ST : Alberta s Energy Reserves 2006 and Supply / Demand Outlook / Economics


31 The EUB focuses on the forecast of WTI rather than bitumen, as the majority of bitumen is upgraded to a synthetic crude oil (SCO) product of similar quality to WTI. Forecasts for the price of heavy crude and bitumen can be estimated by applying the appropriate average differentials to the netback price of WTI at the Alberta wellhead. The EUB expects the bitumen/light-medium differential to average 56 per cent over the forecast period. Wider differentials are noticeable incentives for investment in additional EUB ST : Alberta s Energy Reserves 2006 and Supply/Demand Outlook / Economics 1-7
32 upgrading capacity in North America. The heavy/light-medium differential is expected to remain near the five-year trend, at 68 per cent. Wider differentials between bitumen and Alberta light-medium are due to imbalances in supply and demand. Increases in the supply of bitumen without an increase to the refinery capacity that can process this crude can lead to a wider spread in the short term. Diluent prices also play a role in determining bitumen prices, as more expensive diluent will result in lower bitumen prices. While seasonal variations have always existed, the bitumen/light-medium spread may be wider than heavy/light-medium for quite some time. Further expansion of upgrading capacity, refinery conversions, and more pipeline access to new markets should help stabilize these differentials over the longer term. There are currently three bitumen upgrading sites in Alberta, with ten additional upgraders and a number of debottlenecking and expansion projects planned during the forecast period. As a result, upgraded bitumen product is expected to increase over threefold, from 105 thousand cubic metres per day (10 3 m 3 /d) ( bbl/d) in 2006 to m 3 /d ( bbl/d) by Details on markets for Alberta bitumen are discussed in more detail in Section 2. After meeting Alberta and Canadian refinery demand, the Petroleum Administration for Defense Districts (PADD) 2 and 4 in the United States are the largest importers of Alberta heavy crude and bitumen, with total refinery capacity of m 3 /d ( bbl/d) combined. The expansion at the Flint Hills upgrader, the ConocoPhillips refinery conversion, and other refinery conversions will increase PADD 2 and PADD 4 capacities to take on increasing amounts of Alberta s heavier crudes. However, it is expected that the small-sized expansions and conversions will open up capacity only over the short term, as the growth in Alberta production could quickly fill the gaps. Refinery capacity in the United States has increased somewhat from the early 1990s, but only due to increases in existing capacity. No new refineries have been built since the 1970s. At the same time, product demand has increased significantly and has resulted in refineries in the United States operating at 90 per cent of capacity or more since Additional pipeline infrastructure will provide an avenue for Alberta heavy crude to extend to larger markets in the United States and East Asia. With expected increases in both non-upgraded and upgraded bitumen over the forecast period, adequate incremental pipeline capacity is essential to market greater volumes of Alberta production. During the past few years, pipeline companies have made strides towards completing existing projects, as well as moving ahead with the necessary steps involved with planning and executing new projects. In summary, twelve proposed new pipelines and pipeline expansions indicate an overall increase in crude oil pipeline capacity of m 3 /d ( bbl/d) to the Alberta market and m 3 /d ( bbl/d) for the export market, some with the potential to reach PADD 3, PADD 5, and East Asia. This represents an increase of 50 per cent in Alberta SCO and non-upgraded bitumen pipeline capacity and an 80 per cent increase in export pipeline capacity. If production follows our current forecast, additional Alberta crude oil pipeline capacity will be required in the 2010 to 2012 time frame. The proposed Alberta pipeline projects include built-in capacity for future increases in deliveries as production grows in the Athabasca region. In addition to increased crude oil pipeline capacity, three new pipelines 1-8 EUB ST : Alberta s Energy Reserves 2006 and Supply / Demand Outlook / Economics

33 will be dedicated to moving m 3 /d of condensate (diluent) from the U.S. midwest and from the B.C. west coast to the Edmonton area. Figure 1.6 provides information on U.S. refineries by PADD. PADD 3 has the largest refinery capacity in the United States, with 52 operating refineries and net crude oil distillation capacity of m 3 /d (8.3 million bbl/d), plus the existing capability of refining heavier crudes. PADD 3 was not always viewed as the most likely market for Alberta because of inadequate pipeline infrastructure and its proximity to Mexican and Venezuelan crude production. Traditional crude inputs to PADD 3 have been on the decline, suggesting a more tangible opportunity for Alberta heavy crude producers while plans to increase pipeline capacity to the area are under way North American Natural Gas Prices While crude oil prices are determined globally, natural gas prices are set in the North American market with little global gas market influence. Alberta natural gas prices are heavily influenced by events in the United States, the largest importer of Alberta natural gas. Natural gas prices are impacted to some extent by crude oil prices, as some substitution does occur due to the price differential between the two commodities. About 10 per cent of industrial users in the United States can switch between oil and natural gas for power production. Figure 1.7 shows historical data and the EUB forecasts of natural gas prices at the plant gate from 1996 to EUB ST : Alberta s Energy Reserves 2006 and Supply/Demand Outlook / Economics 1-9


34 Alberta gas prices trended almost consistently downward in 2006, from a high of $9.52 per gigajoule (GJ) in January to a low of $4.40 in October. A warm winter season in the U.S. northeast early in the year allowed storage levels of natural gas to reach record levels. The hurricane season turned out to be mild, and natural gas producers returned to their full capacity in the Gulf of Mexico. Since then prices have slowly moved upward, as winter finally greeted the U.S. northeast and eastern Canada. But as the 2007 winter heating season comes to a close in early March in the United States, storage levels will likely remain above their five-year average going into the summer cooling season. This will keep prices tempered to an average range of $6.00- $8.00 per gigajoule (GJ) in Some upside risks to the forecast exist if another shock were to occur for example, if the hurricane season starts early in the United States and leads to production disruptions in the Gulf of Mexico, or if the summer is particularly hot and cooling requirements soar. The EUB assumes a normal hurricane season combined with normal cooling requirements for both the United States and Canada. The Alberta gas-to-light-medium-oil price parity on an energy content basis was only 0.56 for 2006, as the price of natural gas fell more quickly than oil and remained much lower until the end of During the 2001 to 2005 period, the parity averaged Over the forecast period, the price of natural gas is expected to increase slowly to reach an average of $8.35 by 2016, while the top end of this range could surpass $10.00/GJ. The gas-to-oil price parity is expected to average 0.66 over the forecast period. A gas-to-oil discount is likely to remain in the short to long term for a number of reasons. As mentioned earlier, oil is a world price, while natural gas prices are regional. Oil prices respond instantaneously to global events, such as demand or supply shocks in various nations or geopolitics, while natural gas responds mainly to regional supply and demand conditions. Most important, demand for oil globally is particularly inelastic in the key transportation sector. This means that consumers will pay for it no matter what the cost, because there is no short-term substitute for refined products, such as gasoline, diesel, jet fuel, and heating. Furthermore, as more consumers become wealthier in the rapidly 1-10 EUB ST : Alberta s Energy Reserves 2006 and Supply / Demand Outlook / Economics
35 developing economies of China and India, they too will demand more transportation goods and services. Natural gas, on the other hand, does not have the wide-ranging demand of crude oil or refined petroleum products. It may, however, have the potential to become a global commodity if the trade in liquefied natural gas (LNG) is developed globally, but only over the longer term. There are plans for LNG to be transported throughout the world, but the location and construction of LNG liquefaction facilities remain highly contentious issues. Even then, natural gas will likely never become a dominant fuel in the important transportation sector. Despite the impact that intercontinental trade in liquefied natural gas (LNG) could have on gas prices in North America, the EUB believes that LNG will not capture a high market share in North America over the forecast period, primarily due to the risk and regulatory requirements for construction of gasification terminals. Furthermore, while there are substantial natural gas reserves worldwide that can be tapped into for liquefaction purposes, lining up supply for specific projects is proving to be more difficult than expected. The LNG landed price on the U.S. east coast is in the US$6.00 to $8.00/GJ range and is competitive with gas prices set at the Henry Hub pricing point. It is expected that LNG suppliers will not price their gas at their marginal cost, but rather at a level that the market can bear in order to maximize their revenue. Similar to the 2006 forecast, the EUB believes the current forecast for natural gas prices will be more a reflection of future supply and demand conditions in both the United States and Canada. Coalbed methane (CBM) is expected to provide an increasing share of Alberta s total natural gas production, but the industry is still relatively new, and exploration and production in the province are greeted with significant landowner opposition. CBM is also not likely to offset the downward trend in conventional gas production Electricity Pool Prices in Alberta The electricity price paid by consumers consists of a wholesale market price determined in the power pool, transmission and distribution costs, and a fixed monthly billing charge. Since deregulation, the wholesale or pool price of electricity in Alberta has been determined by the balance between electricity supply and demand. Table 1.1 shows the average pool prices and electricity load, along with hourly minimums and maximums experienced during each month in The 2005 average is included for comparison. Corresponding with declining Alberta spot prices for natural gas, over the first four months of 2006 the monthly average pool price continued to slide from the average high reached last November ($125/megawatt-hour [MWh]). The average pool price reached a low of $43/MWh in April. Electricity prices turned around in late spring and early summer, despite a continuing decline in the spot price of natural gas. The monthly average pool price was elevated to $128/MWh in July, due to a tightening of electricity supply and demand caused by planned maintenance and outages at some coal-fired units and increased loads for cooling requirements. An untimely series of unique events on July 24, 2006, exasperated the already narrow margin between supply and demand by causing additional coal-fired units EUB ST : Alberta s Energy Reserves 2006 and Supply/Demand Outlook / Economics 1-11
36 Table 1.1. Monthly pool prices and electricity load Price ($/MWh) Load (MW) 2006 Average Min Max Average Min Max Jan Feb Mar Apr May Jun Jul Aug Sep Oct Nov Dec to trip off line, along with the B.C.-Alberta inter-tie. As a result, on July 24, the pool price was sustained at its price ceiling of $999.99/MWh for nine consecutive hours. The monthly average pool price remained above $70/MWh for the remainder of the year. The average pool price in October was the highest observed since December 2000, despite a continuing lull in natural gas prices. In October a large amount of coal-fired generating capacity was off line. Even though generation owners normally plan maintenance on these units in the fall, when seasonal loads are low, unplanned outages of additional coal-fired capacity resulted in supply shortages that required the dispatch of more costly electricity generating units. Electricity prices in November and December improved, reflecting a movement out of the maintenance period. Figure 1.8 illustrates the historical pool price of electricity in Alberta from 2000 to 2006, as well as the EUB s forecast of average annual pool prices to The average hourly pool price of electricity in 2006 was $80.79/MWh, which is an increase of 15 per cent from $70.36/MWh in The EUB is anticipating that the power pool price will remain elevated in From 2007, the average annual pool price is expected to grow, a reflection of the narrow margin between electricity supply-demand in the province and the EUB s outlook on natural gas prices EUB ST : Alberta s Energy Reserves 2006 and Supply / Demand Outlook / Economics
 area for 2006 and 2007. Table 1.2 outlines the median well depth for each area, a major factor contributing to the drilling costs.")
 Area 1 Area 2 Area 3 Area 4 Area 5 Area 6 Area 7 Gas wells 3420 2368 706 630 888 467 914 Oil wells 3228 2015 1222 725 1560 NA 1673 NA Not applicable.")
37 1.3 Oil and Gas Production Costs in Alberta Drilling and completion cost estimates for typical oil and natural gas wells are shown in Figure 1.9 by Petroleum Services Association of Canada (PSAC) area for 2006 and Table 1.2 outlines the median well depth for each area, a major factor contributing to the drilling costs. Many other factors influence well costs, including surface conditions, sweet versus sour production, and completion method. Table 1.2. Alberta median well depths by PSAC area, 2006 (m) Area 1 Area 2 Area 3 Area 4 Area 5 Area 6 Area 7 Gas wells Oil wells NA 1673 NA Not applicable. In the four PSAC areas where oil wells were drilled, all areas exhibited a mild increase in the median cost to drill a well, with the exception of Area 3, which showed a decrease of 2.2 per cent (Figure 1.9). The cost decrease can be attributed to a decrease in the rig drilling and standby costs on a per day/unit basis. Costs to drill an oil well do not vary substantially across the province, the way they do for natural gas wells. They range from as low as $ in East Central Alberta (Area 4) to as high as $ in Central Alberta (Area 5). Costs to drill and complete a well for natural gas production in Alberta have also risen with time. Gas well drilling and completion costs have risen in all areas of the province from 2006 to 2007, albeit at a fairly tame pace. On average, drilling and completing costs have risen by only 1.9 per cent across the seven PSAC areas. This is probably due to the fact that drilling costs in most areas escalated significantly over the 2004 to 2006 period. EUB ST : Alberta s Energy Reserves 2006 and Supply/Demand Outlook / Economics 1-13
, a typical gas well could cost around $240 000 to drill and complete. 1.")
 are key indicators that affect Alberta s economy but are beyond the province s control.")

38 Recent costs to drill and complete a typical gas well are highest in the Foothills area, at close to $3 million, but could range significantly higher for deeper wells. In Southeastern Alberta (Area 3), a typical gas well could cost around $ to drill and complete. 1.4 Canadian Economic Performance Canadian economic growth, interest rates, inflation, unemployment rate, and currency exchange rates (particularly vis-à-vis the U.S. dollar) are key indicators that affect Alberta s economy but are beyond the province s control. The Canadian performance of the above economic indicators between 1997 and 2006 are depicted in Figure Canada s most recent annual performance of these indicators and the forecast to 2016 are presented in Table 1.3. Table 1.3. Major Canadian economic indicators, a b Real GDP growth 2.7% 2.4% 3.0% 2.8% Prime rate on loans 5.8% 5.6% 5.5% 5.5% Inflation rate 2.0% 2.1% 2.0% 2.0% Exchange rate (US/Cdn$) Unemployment rate 6.8% 6.6% 6.6% 6.6% a Actual. b Averaged over EUB ST : Alberta s Energy Reserves 2006 and Supply / Demand Outlook / Economics
 of an economy and its capacity to produce goods and")


39 Economic growth, the percentage change of gross domestic product (GDP) between two points in time, usually a year or a quarter, measures the rate of expansion (or contraction) of an economy and its capacity to produce goods and services. In 2006, despite numerous hurdles, such as the continued appreciation of the Canadian dollar against the U.S. dollar and its effect on exports and the impact of higher energy prices on Canadian industries and consumers, Canada achieved a real GDP growth rate of 2.7 per cent. This was somewhat weaker than the 2.9 per cent growth in 2005, as central Canada s EUB ST : Alberta s Energy Reserves 2006 and Supply/Demand Outlook / Economics 1-15
40 manufacturing sector, in particular the auto and auto parts and wood-related industries, continued to struggle against a strong Canadian dollar and weakening demand for new automobiles in the United States. A driving force of Canada s economic growth in 2006 included significant gains to real gross fixed capital formation, including strong investment in both the private and public sectors. On the business side, nonresidential investment far outpaced residential investment, which grew by a mere 2.4 per cent. This was a big change from recent years, when low interest rates enticed consumers to invest heavily in new housing. On the nonresidential side, building investment advanced by 7.5 per cent and machinery and equipment investment grew by 8.7 per cent. Much of the nonresidential building construction can be explained by the billions invested in Alberta s energy sector. The strong Canadian dollar has made it cheaper for Canadian business to purchase new machinery and equipment from abroad. In total, business investment rose by 6.0 per cent in Government investment rose by 6.4 per cent, as numerous infrastructure projects across Canada are under way. Canada s enviable fiscal situation, with successive years of budget surpluses and growing tax revenues, has allowed the federal government to make significant transfer payments to the provinces to help finance infrastructure projects in the key transportation, education, and health care sectors. Nominal wages and salaries growth of 6.0 also paint a healthy, albeit skewed, picture of the Canadian economy. Income growth has recently been more pronounced in Canada s western provinces (Alberta, British Columbia, and Saskatchewan) compared with central and eastern Canada. Nonetheless, this has boosted overall real consumer expenditures in the country by 3.8 per cent in Imports of goods and services (4.9 per cent) from abroad have also benefited from strong consumer spending and a strong Canadian dollar. Canada s exchange rate appreciated by an average of $0.056 in 2006, with much of the appreciation being triggered by demand for Canada s raw commodities, such as crude oil, natural gas, coal, and other minerals. Canada s energy sector, especially activity in Alberta s oil sands, combined with stable politics and a business-friendly environment, has made Canada a target of foreign investment and has helped to keep upward pressure on demand for the Canadian dollar. The value of real export growth in Canada increased by only 1.0 percentage point in 2006, as demand for Canadian goods, especially raw commodities, surged. The appreciated Canadian dollar, however, has kept a damper on real export growth, as it has become more expensive to import goods and services from Canada. This is particularly true of the country s manufacturing sector, in which some key industries have suffered appreciably due to the strong Canadian dollar and escalating energy costs. Real output in the manufacturing sector actually declined by 0.4 per cent in 2006, with much of the weakness originating in the key autos and parts, wood, and paper products sectors. Good gains were made in the machinery and transportation manufacturing sectors, as demand for these goods in the energy sector soared. Canada s economic growth is expected grow at a good pace over the forecast horizon to average 2.8 per cent per year between 2007 and The exchange rate is expected to remain close to current appreciated levels and average US$0.88 in 2007 and throughout the remainder of the forecast period EUB ST : Alberta s Energy Reserves 2006 and Supply / Demand Outlook / Economics
41 In addition to investment, consumption, and manufacturing gains, economic growth typically implies growth in the labour force and possibly a reduction in the unemployment rate. Canada s unemployment rate in 2006 fell 0.5 percentage points to 6.3 per cent but is expected to increase by 0.3 percentage points in 2007, as more people enter the labour force. Employment in the country grew by 2.0 per cent in 2006, the highest growth rate since In some cases growth can be so strong that it can create inflationary pressures within the economy as it operates at or close to capacity. The inflation rate is used to monitor changes in the cost of living in a society, as it measures the rate at which the price of goods and services is increasing. Low inflation enables an economy to function more effectively by allowing individuals to be more confident in their spending and investment decisions. It also encourages longer-term investments, sustained job creation, and higher productivity, which result in improvements in the standard of living. Inflation is expressed in terms of changes in the total consumer price index (CPI) or the core CPI. The core CPI, a variation on the total CPI, excludes the eight components from the total CPI reference basket that exhibit the most price volatility (fruit, vegetables, gasoline, fuel oil, natural gas, mortgage interest, intercity transportation, and tobacco products), as well as the effect of changes in indirect taxes on the remaining components. The Bank of Canada keeps Canada s inflation under control by influencing short-term interest rates (monetary policy) to achieve a level of economic stimulus consistent with the inflation-control target range, which is between 1 and 3 per cent. The Bank of Canada s policy aims to keep inflation at the midpoint of this range, at 2 per cent. The average annual interest rate on prime business loans was 5.8 per cent in 2006, an increase of 1.4 percentage points over the 2005 average rate. The rise in interest rates comes about from the Bank of Canada s decision to increase the target overnight rate a full percentage point during the first half of 2006 in an effort to keep the level of inflation in Canada within the target range. The rate of inflation in 2006 reached 2.0 per cent, a 0.2 percentage point drop from the previous year. It is expected that the Canadian economy in 2007 will operate close to its productive capacity, albeit at a somewhat slower pace than seen over the past three years. This is due in large part to a weaker central Canadian economy compared with the roaring economy of western Canada. Therefore, further increases to the interest rate in 2007 are not expected, as employment growth, consumption, and inflationary pressure for Canada as a whole will likely remain tame due to economic deceleration in central Canada. In fact, if key economic variables in the Canadian economy exhibit weakness in the coming months, the Bank of Canada may decrease interest rates two quarters of a percentage point. As a result, the interest rate on prime business loans is expected to average 5.6 per cent and total inflation will reach 2.1 per cent in In 2008 and beyond, the EUB outlook assumes that monetary policy will remain unchanged, with the prime rate at 5.5 per cent and inflation around the midpoint of the target range. 1.5 Alberta Economic Outlook Alberta real economic growth averaged 4.0 per cent per year between 1997 and Real GDP growth reached 6.8 per cent in 2006 and is expected to grow by a further 5.0 per cent in Alberta has the highest GDP per capita among the provinces, averaging $ per person over the last five years, which is 16 per cent higher than the GDP per capita of the second-highest province, Ontario. EUB ST : Alberta s Energy Reserves 2006 and Supply/Demand Outlook / Economics 1-17
42 The EUB forecast of Alberta s real GDP and other economic indicators is given in Table 1.4. Real GDP growth is set to average 5.5 per cent in the near term and 3.0 per cent over the remainder of the forecast. Alberta s inflation was measured at 3.9 per cent in 2006, quite a bit above the national average of 2.0 per cent. The province is dealing with exceptional economic growth and strong population growth, which are feeding cost increases throughout the province. In the near term it is expected that prosperous economic growth will continue and inflation to remain above the national average. The positive economic outlook, however, will continue to contribute to excellent job prospects, low levels of unemployment, real increases in average employment earnings, and growth in personal disposable income. Table 1.4. Major Alberta economic indicators, (%) 2006 a b Real GDP growth Real personal disposable income growth Inflation rate Employment growth Population growth Unemployment rate a Actual. b Averaged over One caveat is that the province is strained to fill all the vacant employment positions, which has caused inflationary pressures in key areas of the economy. Over the near to long term, the province will need to attract a large number of workers from outside of the province, including from abroad, for economic growth to continue at the pace anticipated. The main contributors to Alberta s current and future economic growth are large gains in investment expenditure, particularly in the oil sands sector, relatively high energy prices, and a steady rate of growth in personal consumption. The spin-offs from increased investment and consumption will mean increased output in many of Alberta s major sectors, including nonconventional energy resources, petroleum, coal, and chemical product manufacturing, as well as retail and wholesale trade and service industries. Much of Alberta s additional mineral fuel and refined product production will be destined for the export market. Investment in construction and machinery and equipment in the province has been defying most expectations over the past few years, and the bulk of expenditure, particularly in the province s energy sector, is yet to come. Since the early part of the decade, global oil and North American natural gas prices have skyrocketed due to increasing demand, dwindling spare capacity, and geopolitics (in the case of crude oil). Many analysts expected prices to drop more in range with historical levels, but they remained stubbornly high. This has caused exploration, drilling, and extraction to surge in Alberta. It has also made previously uneconomic unconventional oil extraction become profitable. In fact, the oil sands sector has become the target of interest for investors worldwide and has contributed to massive investment in the sector. Most of the investment in the oil sands sector has recently been focused on surface mining projects. Syncrude Canada Ltd. and Suncor Energy Inc. have been extracting bitumen from surface mined oil sands for decades, while Shell Canada Ltd. has developed the third surface mining project. Much of the future oils sands related 1-18 EUB ST : Alberta s Energy Reserves 2006 and Supply / Demand Outlook / Economics

 will reach $28 billion, while investment in")
43 investment, however, will be geared toward in situ type extraction methods and bitumen upgrading. In addition, investment in much-needed pipeline infrastructure to move the product to new and existing markets is also anticipated. From 2007 until 2016 the EUB expects total real investment expenditure related to oil sands (surface mining, upgrading, in situ, and support services) to reach about $118 billion. Real investment in commercial services (pipelines, transmission lines, electricity generation, natural gas distribution, and oil and natural gas storage) will reach $28 billion, while investment in petrochemical manufacturing and refining is thus far slated to receive $16 billion in investment. Figure 1.11 illustrates the profile of real investment in Alberta s energy, business, residential, and government sectors from 1997 until Historically, much of the volatility in Alberta s investment was strongly influenced by resource prices, interest rates and, of course, economic performance. While this trend is expected to continue, investment in the oil sands will become a major contributor to overall growth in investment well into the long term. Total real investment expenditure is expected to grow by an average of 7.5 per cent over 2006 to 2008, before decelerating significantly. Growth will contract by an average of 1.1 per cent over the 2009 to 2016 period. In the event that oil sands projects are delayed or as new oil sands projects are announced, investment growth may become more pronounced towards the end of the forecast period. The EUB expects the deflator related to construction investment to continue exhibiting inflationary pressure well above the CPI as capital, labour, and material are priced at a premium in the province. Construction-related costs have escalated sharply in the province over the past few years, and not only for construction related to the energy sector. Material and labour costs for infrastructure projects in transportation, education, and health care have also grown significantly. EUB ST : Alberta s Energy Reserves 2006 and Supply/Demand Outlook / Economics 1-19
44 Almost all areas of the Alberta economy are feeling the pinch from not being able to hire as many workers as necessary to accommodate the needs of rapidly growing economy. The unemployment rate in the province has fallen almost steadily from its peak of 9.6 per cent in 1993 to 3.5 per cent in The economy is operating well below full employment (usually defined as the non-accelerating inflation rate of unemployment and thought to be about 6.0 per cent or less for Canada as a whole) and has been operating at that level for a number of years. Employment grew by 4.8 per cent in 2006, but it is unlikely that it will grow at the same pace in the near term as migration slows. Over the forecast period, employment growth will average 2.2 per cent, a pace that is stronger than the national rate. The labour force participation rate will remain fairly consistent, at between 80 to 81 per cent. With tight labour supply and growing labour demand comes excellent earning potential. Average real wages and salaries per employee have grown at the fastest pace in the country and will continue at a good pace until labour supply and demand are in equilibrium. High salaries, combined with the lowest personal taxes in the country, have also made real personal disposable income the highest in Canada. Real personal disposable income grew by 8.0 per cent in Over the rest of the forecast period, its growth will average 3.4 per cent. The increase in earnings will continue to propel consumer expenditures, which have also been expanding at a fast pace in the province recently. In 2005 real consumer expenditures surged by 6.7 per cent, and 2006 growth is expected to near 5.7 per cent. As inflationary pressures continue, real consumption will be somewhat eroded and spending will advance by 4.0 per cent in Over the remainder of the forecast, real consumption growth will average 4.2 per cent. Real provincial exports, net of inflation, which include interprovincial transactions of goods, grew by 5.2 per cent in 2006 and are set to grow by 5.5 per cent in Over the remainder of the forecast, real export growth will average 3.7 per cent. Canada s strong exchange rate further out in the forecast period implies that export growth will be weaker compared with the near term. As disposable income and prospects for high-paid employment grow over the forecast period, consumers will continue to demand more goods and services with many of these originating from abroad. Real import growth expanded by 6.7 per cent in 2006, following 8.3 per cent in Much of the import growth can be attributed to a strong Canadian dollar, which has made these goods cheaper for Canadians. As the EUB expects the exchange rate to remain around US$0.86 over the forecast, high by historical standards, Albertans will continue to demand imported goods. In addition, businesses will find it cheaper to purchase new machinery and equipment from abroad. Investment in machinery and equipment has been strong over the past couple of years, as the price of these imported goods has fallen. Today s energy prices are the driving force fuelling the current pace of exploration and development activity. The assumption of prices remaining high by historical standards will increase the likelihood of further investment in upstream and downstream oil and gas infrastructure. If current prices are sustained, the effect could provide long-term stability to the current level of economic activity in Alberta, thus adding to its economic potential and standard of living EUB ST : Alberta s Energy Reserves 2006 and Supply / Demand Outlook / Economics
45 Conventional gas wells connected and oil wells placed on production in Alberta have remained at stable levels over the past few years. In 2005, conventional gas wells and 1881 conventional oil wells were connected and placed on production in Alberta. An additional conventional gas wells were connected and 1956 conventional oil wells were placed on production in Also in 2005, some 2307 CBM (unconventional gas wells) were placed on production. In 2006, this number increased to 2434 wells. The EUB price forecast supports the current pace of activity going forward. In 2007, an additional conventional gas wells, 2000 conventional oil wells, and 1900 CBM wells are expected to be tied into production. Energy prices are also providing greater incentives to commercially develop Alberta s unconventional energy resources, such as CBM and crude bitumen. Production rates from unconventional resources are expected to increase significantly over the coming decade. As a result, the total economic value of Alberta s produced unconventional resources (shown in Table 1.5), in particular crude bitumen and SCO derived from the oil sands, will more than offset the decline of conventional resource production. Table 1.5. Value of Alberta energy resource production (millions of current dollars) a 2008 a a,b Conventional crude oil Crude bitumen Synthetic crude oil Marketable gas Natural gas liquids Sulphur Coal n/a n/a n/a n/a Total (excludes coal) a Values calculated from the EUB s annual average price and production forecasts. b Annual average over CBM production accounted for 3 per cent of marketable natural gas production in By 2016, gas production from CBM wells will increase to 13 per cent of marketable gas production. However, the additional marketable gas production from unconventional sources will fall short of offsetting the decline in conventional natural gas production. Investment in refineries and upgraders within Alberta will enable increased volumes of crude bitumen to be upgraded into higher valued SCO product, further providing longterm stability for GDP growth and employment. As well, investments in pipeline infrastructure will improve access to markets outside of Alberta. As a result, exports of Alberta s SCO product will increase from 63 per cent of the total SCO production in 2006 to 83 per cent of SCO production by Higher energy prices are leading to increased revenues at oil and gas companies and higher operating expenditures. Today in Alberta, companies are competing with each other for skilled workers, drilling contracts, and support services. Equipment and labour are increasingly scarce and have driven costs up significantly, especially during periods of high seasonal demand. Many of these limitations are acknowledged by industry, and in some cases, when supply cannot respond to the increasing demands, unique solutions are being applied. For instance, companies are responding to the tight labour market by sponsoring training and apprenticeships, by luring migrants from within Canada and internationally, and even by providing air transportation to draw workers from other regions of the province and country. EUB ST : Alberta s Energy Reserves 2006 and Supply/Demand Outlook / Economics 1-21
46 Alberta s current and future economic growth will continue to provide a strong push for Canada s future economic growth. The province is leading many other provinces in terms of employment, population and income growth. As well, Alberta has achieved a considerably low unemployment rate. The EUB forecast for Alberta s economic growth is attainable; however, strong growth will imply a tight labour market, inflationary pressure, and significant labour and material costs. While population growth is helping to deal with the labour shortage, it could perpetuate the negative aspects of rapid economic growth by increasing the demand for essential services, such as housing, health, education, and public transportation EUB ST : Alberta s Energy Reserves 2006 and Supply / Demand Outlook / Economics
 and carbonate formations in the northern part of the province.")


47 2 Crude Bitumen Crude bitumen, a type of heavy oil, is a viscous mixture of hydrocarbons that in its natural state does not flow to a well. In Alberta, crude bitumen occurs in sand (clastic) and carbonate formations in the northern part of the province. The crude bitumen and the rock material it is found in, together with any other associated mineral substances other than natural gas, are called oil sands. Other heavy oil is deemed to be oil sands if it is located within an oil sands area. Since these deemed oil sands will flow to a well, they are amenable to primary development and are considered to be primary crude bitumen in this report. North of Fort McMurray, crude bitumen occurs near the surface and is recovered by open pit mining. The oil sands are excavated and the bitumen is extracted from the mined material in large facilities. At greater depths, the bitumen is recovered in situ. In situ recovery takes place both by primary development and by enhanced development, whereby steam, water, or other solvents are injected into the reservoir to mobilize the bitumen and bring it to a vertical or horizontal wellbore. The three designated oil sands areas (OSAs) in Alberta, as of the end of 2006, are shown in Figure 2.1. Each oil sands area contains a number of bitumen-bearing deposits. The known extent of the largest deposit, the Athabasca Wabiskaw-McMurray, as well as the significant Cold Lake Clearwater and Peace River Bluesky-Gething deposits, are shown in the figure. As an indication of scale, the right-hand edge shows township markers that are about 50 kilometres (km) (30 miles) apart. EUB ST : Alberta s Energy Reserves 2006 and Supply/Demand Outlook / Crude Bitumen 2-1
48 2.1 Reserves of Crude Bitumen Provincial Summary Over the past few years, the EUB has been working towards updating Alberta s resources and reserves of crude bitumen. This initiative continues and will likely be ongoing for some years, as rapid development of the resource continues. The initial step in this review is to update the in-place resources for the most significant of the province s 15 oil sands deposits, those currently with production and consequently containing established reserves. To date, three of the most important deposits have been updated. The largest deposit, the Athabasca Wabiskaw-McMurray (AWM), was significantly updated for year-end 2004 and revised slightly last year. The AWM has the largest cumulative and annual production. The deposit with the second largest production, the Cold Lake Clearwater (CLC), was updated last year, as was the northern portion of the Cold Lake Wabiskaw-McMurray (CLWM) deposit. For year-end 2006, the Peace River Bluesky- Gething (PRBG) deposit has been updated and is shown to be more areally extensive than previously published. These four deposits contain over 60 per cent of the total initial inplace bitumen resource and about 86 per cent of the in-place resource found in clastics. Once the in-place resources have been determined, the EUB will review Alberta s established reserves on both a project and deposit basis. This work is anticipated to take some time to complete. (See Section for more on the ongoing review.) As a result, there are no significant changes to the estimate of the established reserves of crude bitumen for this year s report and, therefore, the remaining established reserves of crude bitumen at December 31, 2006, are billion cubic metres (10 9 m 3 ). This is a slight reduction from the previous year due to production of m 3. Of the total m 3 remaining established reserves, m 3, or about 82 per cent, is considered recoverable by in situ methods and m 3 recoverable by surface mining methods. Of the in situ and mineable totals, m 3 is within active development areas. Table 2.1 summarizes the in-place and established mineable and in situ crude bitumen reserves. Table 2.1. In-place volumes and established reserves of crude bitumen (10 9 m 3 ) Recovery method Initial volume in-place Initial established reserves Cumulative production Remaining established reserves Remaining established reserves under active development Mineable In situ Total (1 701) a (178.7) a (5.4) a (173.2) a (21.0) a a Imperial equivalent in billions of barrels. The changes, in million cubic metres (10 6 m 3 ), in initial and remaining established crude bitumen reserves and cumulative production for 2006 are shown in Table 2.2. The portion of established crude bitumen reserves within approved surface-mineable and in situ areas under active development are shown in Tables 2.4 and 2.5 respectively. 2-2 EUB ST : Alberta s Energy Reserves 2006 and Supply/Demand Outlook / Crude Bitumen
49 Table 2.2. Reserve change highlights (10 6 m 3 ) Change a Initial established reserves Mineable In situ Total ( ) b ( ) b Cumulative production Mineable In situ a Total Remaining established reserves Mineable In situ Total a ( ) b ( ) b a Differences are due to rounding. b Imperial equivalent in millions of barrels. Crude bitumen production in 2006 totalled m 3, with m 3 coming from in situ operations. Production from the three current surface mining projects amounted to m 3 in 2006, with m 3 from the Syncrude Canada Ltd. project, m 3 from the Suncor Energy Inc. project, and m 3 from the Albian Sands Energy Inc. project. Figure 2.2 compares the relative size of Alberta s initial and remaining established crude oil and crude bitumen reserves. While most of Alberta s known conventional crude oil reserves have been produced, most of the crude bitumen has yet to be tapped Initial in-place Volumes of Crude Bitumen Alberta s massive crude bitumen resources are contained in sand (clastic) and carbonate formations in the three OSAs: Athabasca, Cold Lake, and Peace River, as shown in Figure 2.1. Contained within the OSAs are the 15 oil sands deposits, which designate the specific geological zones containing the oil sands. Together the three OSAs occupy an area of about km 2 ( square miles). The quality of an oil sands deposit depends primarily on the degree of saturation of bitumen within the reservoir and the thickness of the saturated interval. Bitumen saturation can vary significantly within a reservoir, decreasing as the reservoir shale or clay content increases or as the porosity decreases. Increasing water volume within the pore space of the rock also decreases bitumen saturation. Bitumen saturation is expressed as mass per cent in sands (the percentage of bitumen relative to the total mass of the oil sands, which includes sand, shale or clay, bitumen, and water) and per cent pore volume in carbonates (the percentage of the volume of pore spaces that contain bitumen). The selection of appropriate saturation and thickness cutoffs varies, depending on the purpose of the resource evaluation and other factors, such as changes in technology and economic conditions. EUB ST : Alberta s Energy Reserves 2006 and Supply/Demand Outlook / Crude Bitumen 2-3
50 Initial in-place volumes of crude bitumen in each deposit were determined using drillhole data, including geophysical logs, core, and core analyses. Initially, crude bitumen within the Cretaceous sands was evaluated using a minimum saturation cutoff of 3 mass per cent crude bitumen and a minimum saturated zone thickness of 1.5 m for in situ areas. As of year-end 1999, cutoffs were increased to 6 mass per cent and 3.0 m for areas amenable to surface mining. In the two previous reports, the AWM and CLC deposits, as well as a portion of the CLWM deposit, were estimated at a 6 mass per cent saturation cutoff. This year s report also uses 6 mass per cent with the update of the PRBG deposit. The crude bitumen within the carbonate deposits was determined using a minimum bitumen saturation of 30 per cent of pore volume and a minimum porosity value of 5 per cent. The EUB believes that the oil sands quality cutoff of 6 mass per cent more accurately reflects the volumes from which bitumen can be reasonably expected to be recovered; consequently, deposits that are updated in the future will likely be at this level. Based solely on a change from 3 to 6 mass per cent (other factors held constant), the estimated impact on the bitumen resource in place would be a decrease of about 20 per cent for the AWM, about 35 per cent for the CLC, and more than 50 per cent for the PRBG. However, work on these deposits has shown that some or all of this reduction is offset by increases due to new drilling since the previous estimate. This year s reassessment of the PRBG, for example, shows a small increase in the initial in-place volume due to additional drilling, which has expanded the known extent of the deposit, particularly to the northeast. In 2003, the EUB completed a regional geological study of part of the Wabiskaw- McMurray deposit of the Athabasca OSA. 1 The purpose of that study was to identify where gas pools are associated with recoverable bitumen. To support both that study and the reassessment of the AWM, geologic information from over wells and bitumen content evaluations conducted on over 9000 wells were used. The stratigraphic framework developed for the regional geological study was used to define 21 stratigraphic intervals, which were subsequently combined into 12 zones within the AWM. In 2005, nearly 700 new wells were added to the reassessment and the volumes and maps were revised. 1 EUB, 2003, Report 2003-A: Athabasca Wabiskaw-McMurray Regional Geological Study. 2-4 EUB ST : Alberta s Energy Reserves 2006 and Supply/Demand Outlook / Crude Bitumen
51 Figure 2.3 is a bitumen pay thickness map, revised for year-end 2005, for the AWM deposit based on cutoffs of 6 mass per cent and 1.5 m thickness. In this map the deposit is treated as a single bitumen zone and the pay is accumulated over the entire geological interval. For year-end 2005, the EUB completed its reassessment of the CLC deposit. This deposit contains the first commercial in situ bitumen development at Imperial s Cold Lake project, which commenced production in In its review, the EUB used stratigraphic information from more than 8000 wells and detailed petrophysical evaluations from almost 2600 wells to define the regional stratigraphy and estimate the in-place resources for the CLC. Figure 2.4 is a bitumen pay thickness map for the CLC deposit based on cutoffs of 6 mass per cent and 1.5 m thickness. As the CLC does not contain regionally mappable internal shales or mudstones that can act as seals, the deposit is mapped as a single bitumen zone. For year-end 2006, the PRBG deposit was reassessed. This deposit contains the in situ bitumen development at Shell Canada s Peace River project, started in To complete its review, the EUB used stratigraphic information from more than 6500 wells and detailed petrophysical evaluations from almost 1800 wells. The relatively large number of stratigraphic wells was needed to fully define the deposit and the related palaeography because of the series of highlands that existed in the area at the time of deposition. Figure 2.5 is a map of the reconstructed sub-cretaceous unconformity beneath the Gething Formation at the time of the deposition of the Bluesky-Gething sediments. The relative elevations for this erosional surface were created by first flattening the top of the Bluesky Formation and then applying those adjustments to the current unconformity surface. Due to the general lack of drilling information in many areas, the location and extent of the various highlands shown in the figure are considered preliminary and subject to change. Figure 2.6 is a bitumen pay thickness map for the PRBG deposit based on cutoffs of 6 mass per cent and 1.5 m thickness. Even though the PRBG does not contain regionally mappable internal seals, the Gething Formation does contain shale layers and is generally a poorer reservoir than the overlying Bluesky. However, consistent with Figure 2.3, the PRBG is mapped as a single bitumen zone so that the full extent of the deposit can be shown. The deposit is now mapped beyond the current boundaries of the Peace River OSA; as a result, the EUB will both expand the OSA and adjust the common boundary with the Athabasca OSA. The boundary shown in Figure 2.6 is as of year-end The expanded boundary will be released when new OSA orders are issued by the EUB and will be shown in next year s report. Within the area assessed, the saturation cutoff was changed from 3 mass per cent to 6 mass per cent, as previously mentioned. The net change to the initial in-place resources was an increase of m 3, from m 3 to m 3, mainly due to new drilling in areas previously undrilled at the time of the last estimate. Also shown in Figure 2.3 is the extent of the Surface Mineable Area (SMA). The SMA is an EUB-defined area of 37 townships north of Fort McMurray covering that part of the AWM deposit where the total overburden generally does not exceed 75 m. As such, it is presumed that the main recovery method will be surface mining, unlike the rest of Alberta s crude bitumen area, where recovery will be through in situ methods. EUB ST : Alberta s Energy Reserves 2006 and Supply/Demand Outlook / Crude Bitumen 2-5


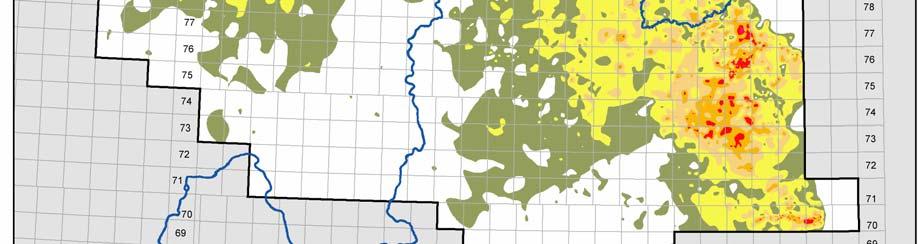

52 2-6 EUB ST : Alberta s Energy Reserves 2006 and Supply/Demand Outlook / Crude Bitumen

 were removed from the mineable total and incorporated into the in situ total.")


53 Because the boundary of the SMA was originally defined using complete townships, it incorporates a few areas of deeper bitumen resources that are more amenable to in situ recovery. With last year s report, the in-place resources in those areas below 80 m in depth ( m 3 ) were removed from the mineable total and incorporated into the in situ total. This change does not affect the established mineable reserves because no quantity of resource economically amenable to mining exists beyond 80 m in depth. Presently there are a few areas between 40 and 80 m of depth that are being developed or considered for in situ extraction. There are likely other areas where in situ extraction may be the most appropriate recovery method. When fully evaluated, these quantities will also be excluded from the mineable total. EUB ST : Alberta s Energy Reserves 2006 and Supply/Demand Outlook / Crude Bitumen 2-7


54 The estimate of the initial volume in place of crude bitumen within the SMA was therefore reduced to m 3, to exclude the bitumen resource beyond 80 m in depth. Notwithstanding this reduction, more than 40 per cent of the above volume has been estimated to be beyond the economic range of current commercial mining. However, it is believed that significant portions of this amount will be subjected to future recovery operations, either by in situ technology or by mining methods operating under enhanced economic conditions. 2-8 EUB ST : Alberta s Energy Reserves 2006 and Supply/Demand Outlook / Crude Bitumen


55 Drilling in recent years north of the SMA boundary has better identified in-place bitumen resources that are potentially recoverable by surface mining methods. The EUB is considering some expansion of the SMA, but no changes were made in Expansion of the SMA boundary in the future would have the impact of transferring some in-place volumes from in situ to mineable categories and increasing the established mineable reserves. No in situ recoverable volumes have been identified in this area, so expansion would have no impact on the established in situ reserves. The crude bitumen resource volumes and basic reservoir data are presented on a deposit basis in Tables B.1 and B.2 respectively in Appendix B and are summarized by EUB ST : Alberta s Energy Reserves 2006 and Supply/Demand Outlook / Crude Bitumen 2-9
56 formation in Table 2.3. Individual maps to year-end 1995 are shown in EUB Statistical Series 96-38: Crude Bitumen Reserves Atlas (1996). The latest maps for the AWM, CLC, and PRBG will be available separately. Table 2.3. Initial in-place volumes of crude bitumen Oil sands area Oil sands deposit Initial volume in place (10 6 m 3 ) Area (10 3 ha) Average pay thickness ( m) Average bitumen saturation Pore Mass volume (%) (%) Athabasca Grand Rapids Wabiskaw-McMurray (mineable) Wabiskaw-McMurray (in situ) Nisku Grosmont Subtotal Cold Lake Grand Rapids Clearwater Wabiskaw-McMurray Subtotal Peace River Bluesky-Gething Belloy Debolt Shunda Subtotal Total Surface-Mineable Crude Bitumen Reserves Average porosity (%) Potential mineable areas within the SMA were identified using economic strip ratio (ESR) criteria, a minimum saturation cutoff of 7 mass per cent bitumen, and a minimum saturated zone thickness cutoff of 3.0 m. The ESR criteria are fully explained in ERCB Report 79-H, Appendix III. 2 This method reduces the initial volume in place of m 3 to m 3 as of December 31, This latter volume is classified as the initial mineable volume in place. Factors were applied to this initial mineable volume in place to determine the established reserves. A series of area reduction factors was applied to take into account bitumen ore sterilized due to environmental protection corridors along major rivers, small isolated ore bodies, and the location of surface facilities (plant sites, tailings ponds, and waste dumps). Each of these reductions is thought to represent about 10 per cent of the total area, and therefore each factor is set at 90 per cent. A combined mining/extraction recovery factor of 82 per cent is applied to this reduced resource volume. This recovery factor reflects the combined loss, on average, of 18 per cent of the in-place volume by the mining operations and the extraction facilities. The resulting initial established reserve of crude bitumen is estimated to be m 3, unchanged from December 31, Energy Resources Conservation Board, 1979, ERCB Report 79-H: Alsands Fort McMurray Project EUB ST : Alberta s Energy Reserves 2006 and Supply/Demand Outlook / Crude Bitumen
57 The remaining established mineable crude bitumen reserve as of December 31, 2006, is m 3, slightly lower than last year s estimate due to the production of m 3 in As of the end of 2006, nearly two-thirds of the initial established reserves were under active development. This large change from year-end 2005 results from updated estimates for the producing mines and the inclusion of projects approved in recent years. Currently, Suncor, Syncrude, and Albian Sands are the only producers in the SMA, and the cumulative bitumen production from these projects is m 3. However, the Fort Hills mine project (owned by Petro-Canada, UTS Energy, and Teck Cominco), the Canadian Natural Resources Ltd. (CNRL) Horizon, and the Shell Canada Ltd. Jackpine projects are considered to be under active development and have been added to Table 2.4. The recently approved Kearl Mine (Imperial Oil/ExxonMobil) is not yet under active development but will be included when it reaches active status. The remaining established crude bitumen reserves from deposits under active development as of December 31, 2006, are presented in Table 2.4. Table 2.4. Mineable crude bitumen reserves in areas under active development as of December 31, 2006 Initial mineable Initial Remaining volume established Cumulative established Project area a in place reserves production reserves Development (ha) (10 6 m 3 ) (10 6 m 3 ) (10 6 m 3 ) (10 6 m 3 ) Albian Sands Fort Hills Horizon Jackpine Suncor Syncrude Total a The project areas correspond to the areas defined in the project approval In Situ Crude Bitumen Reserves The EUB has determined an in situ initial established reserve for those areas considered amenable to in situ recovery methods. Reserves are estimated using cutoffs appropriate to the type of development and differences in reservoir characteristics. Areas amenable to thermal development were determined using a minimum zone thickness of 10.0 m in all deposits except the AWM, where 15.0 m was used for the Wabiskaw zones. For primary development, a minimum zone thickness of 3.0 m (or lower if currently being recovered at a lesser thickness) was used. A minimum saturation cutoff of 3 mass per cent was used in all deposits. Future reserves estimates will likely be based on values higher than the 3 mass per cent. Recovery factors of 20 per cent for thermal development and 5 per cent for primary development were applied to the areas meeting the cutoffs. The deposit-wide recovery factor for thermal development is lower than some of the active project recovery factors to account for the uncertainty in the recovery processes and the uncertainty of EUB ST : Alberta s Energy Reserves 2006 and Supply/Demand Outlook / Crude Bitumen 2-11
58 development in the poorer quality resource areas. These overall recovery factors are currently under review. In 2006, the in situ bitumen production was m 3, an increase from m 3 in Cumulative production within the in situ areas now totals m 3, of which m 3 is from the Cold Lake OSA. Due to production, the remaining established reserves of crude bitumen from in situ areas decreased to m 3. The EUB s 2006 estimate of the established in situ crude bitumen reserves under active development is shown in Table 2.5. Table 2.5. In situ crude bitumen reserves a in areas under active development as of December 31, 2006 Initial Initial Remaining volume established Cumulative established in place Recovery reserves production b reserves Development (10 6 m 3 ) factor (%) (10 6 m 3 ) (10 6 m 3 ) (10 6 m 3 ) Peace River Oil Sands Area Thermal commercial projects Primary recovery schemes Subtotal Athabasca Oil Sands Area Thermal commercial projects Primary recovery schemes Enhanced recovery schemes c (136.7) d Subtotal Cold Lake Oil Sands Area Thermal commercial projects Primary production within projects Primary recovery schemes Lindbergh primary production Subtotal Experimental Schemes (all areas) Active e f 0.1 Terminated e Subtotal Total a Thermal reserves for this table are assigned only for lands approved for thermal recovery and having completed drilling development. b Cumulative production to December 31, 2006, includes amendments to production reports. c Schemes currently on waterflood in the Brintnell-Pelican area. Previous primary production is included under primary schemes. d The in-place number is that part of the primary number above that will see incremental production due to waterflooding. e Averaged values. f Production from the Athabasca OSA is m 3 and from the Cold Lake OSA is m 3. The EUB has assigned initial volumes in place and initial and remaining established reserves for commercial projects, primary recovery schemes, and active experimental schemes where all or a portion of the wells have been drilled and completed. An aggregate reserve is shown for all active experimental schemes, as well as an estimate of initial volumes in place and cumulative production. An aggregate reserve is also shown for all commercial and primary recovery schemes within a given oil sands deposit and 2-12 EUB ST : Alberta s Energy Reserves 2006 and Supply/Demand Outlook / Crude Bitumen
59 area. The initial established reserves under primary development are based on a 5 per cent average recovery factor. The recovery factors of 40, 50, and 25 per cent for thermal commercial projects in the Peace River, Athabasca, and Cold Lake areas respectively reflect the application of various steaming strategies and project designs. That part of the total remaining established reserves of crude bitumen from within active in situ project areas is estimated to be m 3. This decrease is the result of production of m 3 in New projects and expansions to existing commercial thermal projects and primary recovery schemes in the Athabasca and Cold Lake OSAs were not assessed in It is anticipated that as these projects and schemes are added or updated and as approved or announced projects become active, the established reserves totals in Table 2.5 will increase significantly Ultimate Potential of Crude Bitumen The ultimate potential of crude bitumen recoverable by in situ recovery methods from Cretaceous sediments is estimated to be m 3 and from Paleozoic carbonate sediments to be m 3. Nearly m 3 is expected from within the surface-mineable boundary. The total ultimate potential crude bitumen is therefore unchanged at m Ongoing Review of In Situ Resources and Reserves In 2003, the EUB initiated a project to update its resource and reserves numbers for in situ bitumen. There are a number of components to this project, including updating the geological framework for each deposit, reviewing established mass per cent bitumen and thickness cutoffs, re-evaluating all wells to provide data on a detailed incremental thickness basis and storing these evaluations in a new database, evaluating all recent drilling, remapping deposits and recalculating in-place resource volumes, and reviewing recovery factors, changing them where appropriate, and calculating new established reserves volumes. The EUB held a series of bitumen conservation proceedings from 1997 to 2005 to determine the need to shut in gas production to protect potentially recoverable bitumen. As a result of the proceedings, the EUB has accepted that bitumen exceeding 6 mass per cent and 10 m thickness is potentially recoverable. This removes much of the poorer quality component of the bitumen resource (with low potential for recoverability) from the reserve category. Given the relatively early stage of steam-assisted gravity drainage (SAGD) development, it is not yet possible to refine the current deposit-wide recovery factor of 20 per cent with any greater degree of certainty. Furthermore, the impact of the uncertainty in the depositwide recovery factor is noteworthy because a minor change in the recovery factor on a resource of this magnitude has a significant impact on the recoverable component. While a great deal of study and effort have gone into updating the resources of the AWM, the CLC, and now the PRBG, the EUB has not completed its review of recovery factors that should be applied on a deposit-wide basis. The EUB will therefore retain the existing established reserves figure for the province, except for adjustments due to production, until a geological reassessment of other deposits is complete and until further work provides refinement of deposit-wide recovery factors for those deposits with commercial EUB ST : Alberta s Energy Reserves 2006 and Supply/Demand Outlook / Crude Bitumen 2-13
60 production. The EUB is also considering providing a low, best, and high estimate for established bitumen reserves volumes in future updates to take into account uncertainty in some variables, such as the recovery factor. A range in estimates would take into account the relative early stage of development of a very large resource and the long time frames associated with full development. In parallel with this work, the EUB is also continuing with the review of its resource/reserve categories, terminology, and definitions. This is particularly relevant for bitumen, considering the high level of interest in the resource, both nationally and globally, in recent years. 2.2 Supply of and Demand for Crude Bitumen This section discusses production and disposition of crude bitumen. It includes crude bitumen production by surface mining and in situ methods, upgrading of bitumen to various grades of synthetic crude oil (SCO), and disposition of both SCO and nonupgraded bitumen. The nonupgraded bitumen refers to the portion of crude bitumen production that is not upgraded but blended with diluent and sent to markets by pipeline. Upgraded bitumen refers to the portion of crude bitumen production that is upgraded to SCO and is primarily used by refineries as feedstock. Upgrading is the term given to a process that converts bitumen and heavy crude oil into SCO. Upgraders chemically add hydrogen to bitumen, subtract carbon from it, or both. In upgrading processes, the sulphur contained in bitumen may be removed, either in elemental form or as a constituent of oil sands coke. Most oil sands coke is stockpiled, with some burned in small quantities to generate electricity. Elemental sulphur is either stockpiled or shipped to facilities that convert it to sulphuric acid, which is mainly used to manufacture fertilizers. Two methods are used for recovery of bitumen, depending on the depth of the deposit. The shallow-depth deposits in Athabasca (Fort McMurray) are currently recovered by surface mining. In this method, overburden is removed, oil sands ore is mined, and bitumen is extracted using hot water. Unlike the mineable area of Athabasca, other oil sands deposits are located deeper below the surface. For these deposits, in situ methods have been proven technically and economically feasible. These methods typically use heat from injected steam to reduce the viscosity of the bitumen, allowing it to be separated from the sand and pumped to the surface. A number of these deeper deposits can also be put on production with primary recovery, similar to conventional crude oil production. Bitumen crude must be diluted with some lighter viscosity product (referred to as a diluent) in order to be transported in pipelines. Pentanes plus are generally used in Alberta as diluent and represent about 30 per cent of the blend volumes. Diluent used to transport bitumen to Alberta destinations is usually recycled. However, the volumes used to dilute bitumen for transport to markets outside Alberta are generally not returned to the province. SCO is also used as diluent. However, a blend volume of about 50 per cent SCO is required, as the SCO has a higher viscosity and density than pentanes plus. Other products, such as naptha and light crude oil, can also be used as diluent to allow bitumen to meet pipeline specifications. Use of heated and insulated pipelines can decrease the amount of required diluent EUB ST : Alberta s Energy Reserves 2006 and Supply/Demand Outlook / Crude Bitumen
61 The forecast of crude bitumen production and SCO production relies heavily on information provided by project sponsors. Project viability depends largely on the cost of producing and transporting the products and on the market price for bitumen and SCO. Other factors that bear on project economics are refining capacity to handle bitumen or SCO and competition with other supply sources in U.S. and Canadian markets. The forecasts include production from existing projects, expansion to existing projects, and development of new projects. Demand for SCO and nonupgraded bitumen in Alberta is based on refinery demand and SCO used for transportation needs. Alberta SCO and nonupgraded bitumen supply in excess of Alberta demand are removed from the province Crude Bitumen Production Surface mining and in situ production for 2006 are shown graphically by oil sands area in Figure 2.7. In 2006, Alberta produced thousand (10 3 ) m 3 /d of crude bitumen from all three regions, with surface mining accounting for 61 per cent and in situ for 39 per cent. Figure 2.8 shows combined nonupgraded bitumen and SCO production as a percentage of Alberta s total crude oil and equivalent production. Combined SCO and nonupgraded bitumen production volumes have increased from 33 per cent of all production in 1997 to 62 per cent in EUB ST : Alberta s Energy Reserves 2006 and Supply/Demand Outlook / Crude Bitumen 2-15


62 Mined Crude Bitumen Currently, all mined bitumen in Alberta feeds upgraders producing SCO. In 2006, mined crude bitumen production increased by 21 per cent over the past year, to a level of m 3 /d, with Syncrude, Suncor, and Albian Sands accounting for 41, 40, and 19 per cent respectively. After the January fire that damaged one of two upgraders, Suncor experienced significantly higher oil sands production following the return to normal operations in September 2005 and the subsequent expansion of SCO production capacity to m 3 /d. Suncor s average production in 2006 increased by some 55 per cent, compared with 2005 average production, to m 3 /d. Syncrude increased production by 19 per cent to m 3 /d with the start-up of stage three in August 2006, the largest expansion in Syncrude s history. The stage three expansion, which includes a second train at the Aurora Mine and a new coker at the upgrading facilities, increases Syncrude s SCO capacity to m 3 /d from m 3 /d. Albian Sands produced m 3 /d in 2006, a decrease of 14 per cent compared with 2005 volumes. In February 2006, operations were reduced to a single train at both the mine and the upgrader due to a tear in the conveyor belt that carries ore from the crushers in the mine to the bitumen extraction plant. This was followed by a planned turnaround at the Muskeg Mine and Scotford Upgrader in May 2006, which was extended through late June In projecting the future supply of bitumen from mining, the EUB considered potential production from existing facilities and supply from future projects. The forecast includes the existing production and expected expansions of Suncor, including the Voyageur and Voyageur South projects; 2-16 EUB ST : Alberta s Energy Reserves 2006 and Supply/Demand Outlook / Crude Bitumen
 scheduled for completion by year-end 2010; the CNRL Horizon project (approved by the EUB in January")
; the Petro-Canada/UTS Energy/Teck Cominco Fort Hills project (originally TrueNorth Energy s Fort Hills Oil Sands Project, approved by the EUB in October 2002), with production proposed by 2011;")
63 the existing and expected expansions of Syncrude, including stage three with start-up in 2006 and the stage three debottleneck of the four-stage project that began in 1996; the existing Albian Sands project and its debottlenecking projects and expansion (approved by the EUB in November 2006) scheduled for completion by year-end 2010; the CNRL Horizon project (approved by the EUB in January 2004), with proposed production beginning in 2008; the Shell Canada Jackpine Mine (approved by the EUB in February 2004), with production expected two years after the Muskeg Mine expansion (late 2010); the Petro-Canada/UTS Energy/Teck Cominco Fort Hills project (originally TrueNorth Energy s Fort Hills Oil Sands Project, approved by the EUB in October 2002), with production proposed by 2011; the proposed Imperial Oil/ExxonMobil Kearl Mine (approved by the EUB in February 2007), a multiphased project with start-up expected by late 2010 (current plans do not include any on-site upgrading facilities); the Deer Creek (Total E&P Canada) Joslyn North Mine Project, a proposed multistaged development, with production expected in 2013; and the Synenco Energy/SinoCanada Petroleum Northern Lights Mining and Extraction Project, proposed as a two-staged project with initial start-up in late In projecting total mined bitumen over the forecast period, the EUB assumed that potential market restrictions, cost overruns, construction delays, and availability of suitable refinery capacity on a timely basis may affect the timing of production schedules for these projects. Considering these factors, the EUB assumed that total mined bitumen production will increase from m 3 /d in 2006 to about m 3 /d by Total mined bitumen production over the forecast period is illustrated in Figure 2.9. EUB ST : Alberta s Energy Reserves 2006 and Supply/Demand Outlook / Crude Bitumen 2-17

64 In Situ Crude Bitumen In situ crude bitumen production has increased from m 3 /d in 1990 to m 3 /d in Production of in situ bitumen, along with the number of bitumen wells on production in each year, is shown in Figure Corresponding to the increase in production, the number of producing bitumen wells has also increased from 2300 wells to about 8500 wells over the same period. The average well productivity of in situ bitumen wells in 2006 averaged 9.7 m 3 /d. The majority of in situ bitumen, 91 per cent, was marketed in nonupgraded form outside of Alberta, and the remaining 9 per cent was used in Alberta by refineries and upgraders. Similar to surface mining, the future supply of in situ bitumen includes production from existing projects, expansions to existing projects, and development of new projects. In projecting the production from existing and future schemes, the EUB considered all approved projects, projects currently before the EUB, and projects for which it expects applications within the year. For the purposes of this report, it assumed that the existing projects would continue producing at their current production levels over the forecast period. To this projection the EUB has added production of crude bitumen from new and expanded schemes. The assumed production from future crude bitumen projects takes into account past experiences, project modifications, natural gas prices, pipeline availability, and the ability of North American markets to absorb the increased volumes. The EUB also realizes that key forecast factors, such as diluent requirements, gas prices, and light crude and bitumen price differentials, may delay some new projects and affect existing ones. As illustrated in Figure 2.9, the EUB s in situ crude bitumen production is expected to increase to m 3 /d over the forecast period. It is expected that by the end of the forecast period, about 43 per cent of in situ bitumen production will be used as feedstock for SCO production within the province EUB ST : Alberta s Energy Reserves 2006 and Supply/Demand Outlook / Crude Bitumen
65 2.2.2 Synthetic Crude Oil Production A large portion of Alberta s bitumen production is upgraded to SCO. The three major upgraders, Suncor, Syncrude, and Shell Canada, produced m 3 /d, m 3 /d, and m 3 /d of SCO respectively in Currently, Alberta s three upgraders produce a variety of synthetic products: Suncor produces light sweet and medium sour crudes plus diesel, Syncrude produces light sweet synthetic crude, and the Shell upgrader produces intermediate refinery feedstock for the Shell Scotford Refinery, as well as sweet and heavy SCO. Production from new upgraders is expected to align in response to specific refinery product requirements. The existing Suncor and Syncrude plants use different technologies for the conversion of crude bitumen to SCO. Therefore, the SCO yield through upgrading can vary depending on the type of technology, the use of products as fuel in the upgrading, the extent of gas liquids recovery, and the extent of residue upgrading. The overall liquid yield factor for the current Suncor delayed coking operation is about 0.81, while that for the current fluid coking/hydrocracking operation at Syncrude is The overall liquid yield factor for the Albian Sands project, via the Shell upgrader hydrocracking process, is at or above The OPTI/Nexen Long Lake Project will use a new upgrading technology that will have a liquid yield factor of about CNRL will use delayed coking with a liquid yield factor of about To project SCO production over the forecast period, the EUB included existing production from Suncor, Syncrude, and Shell Canada, plus their planned expansions and the new production expected from projects listed below. Production from future SCO projects takes into account the high engineering and project material cost and the substantial amount of skilled labour associated with expansions and new projects in the industry. The EUB also recognizes that key factors, such as the length of the construction period and the market penetration of new synthetic volumes, may affect project timing. The EUB expects significant increases in SCO production over the forecast period based on the following projects. Suncor the continued operation and future expansions of the Firebag In Situ Oil Sands Operation expansion of the existing upgrader (the construction of a pair of coke drums, a sulphur recovery plant, and other crude oil processing equipment) by 2008 Voyageur Phase One establishment of a third upgrader by 2010 and further development of the oil sands mining facilities Voyageur Phase Two expansion of the third oil sands upgrader by 2012 Voyageur South an expanded mining operation located directly south of the proposed Voyageur upgrader Syncrude stage three, including the upgrader expansion and a second train of production at Aurora, which commenced late August 2006 stage three debottleneck estimated to be on stream 2013 EUB ST : Alberta s Energy Reserves 2006 and Supply/Demand Outlook / Crude Bitumen 2-19
66 Shell the debottlenecking projects to increase bitumen processing capacity at the Scotford Upgrader an expansion to the upgrader to correspond with the expansion of the Muskeg Mine by late 2010 upgrading of crude bitumen from the Jackpine Mine OPTI/Nexen Long Lake Project an in situ bitumen recovery and field upgrading facility located about 40 km southeast of Fort McMurray Phase I expected to commence in the fourth quarter of 2007 Phase 2 scheduled for start-up in 2011, followed by Phases 3 and 4 in approximate twoyear intervals at year-end 2006, upgrader construction is about 80 per cent complete Horizon Project located within the Municipality of Wood Buffalo, about 70 km north of Fort McMurray five-phase project expected to begin operation in the third quarter of 2008 at year-end 2006, 57 per cent of project construction completed Fort Hills plans include a mine and extraction facility, with an associated upgrader to be built in the Alberta Industrial Heartland Area of Sturgeon County by 2011 Joslyn Project upgrader to be constructed in Strathcona County in association with the mine and extraction project, with start-up expected in 2013 Northern Lights Upgrader a fully integrated oil sands project that involves a two-staged development, with start-up expected by 2010 proposed upgrader to be located in Sturgeon County BA Energy Heartland Upgrader a merchant upgrader located near Fort Saskatchewan capable of processing bitumen blends from the Athabasca oil sands mining and in situ operations designed to be built in three phases, with start-up in 2008 approved by the EUB in July 2005 NorthWest Upgrader a merchant upgrader, located within the Industrial Heartland Area of Sturgeon County, to process bitumen produced by oil sands in situ and mining operations 2-20 EUB ST : Alberta s Energy Reserves 2006 and Supply/Demand Outlook / Crude Bitumen


67 development of upgrader to be done in three phases, with the first phase expected to come on stream in 2010 Peace River Oil Bluesky Project Bluesky plant located in the south-central quadrant of the Peace River Arch proposed upgrader to be built in phases, with the first phase expected to come on stream in 2011 North American Oil Sands Corporation Upgrader Project plans include an upgrader to be built in Strathcona County in association with the Kai Kos Dehseh Project, a SAGD project located near Conklin, Alberta start-up expected in 2012 Value Creation Inc. Terre de Grace an in situ bitumen recovery and field upgrading facility located about 90 km northwest of Fort McMurray designed to be built in stages, with startup of phase 1 in 2011 Due to uncertainties regarding timing and project scope, some projects recently or soon to be announced have not been considered in this forecast. If production were to come on stream from these proposed projects, it would be in the latter part of the forecast period. Figure 2.11 shows the EUB projection of SCO production. SCO production is expected to increase from m 3 /d in 2006 to m 3 /d by EUB ST : Alberta s Energy Reserves 2006 and Supply/Demand Outlook / Crude Bitumen 2-21
68 2.2.3 Pipelines With the expected increase in both SCO and nonupgraded bitumen over the forecast period, adequate incremental pipeline capacity is essential to market greater volumes of product. Throughout 2006, pipeline companies made strides towards completing existing projects, as well as moving ahead with the necessary steps involved in planning and executing new projects. The current pipeline systems in the Cold Lake and Athabasca areas are described in Table 2.6. Figure 2.12 shows the current pipelines and proposed crude pipeline projects within the Athabasca and Cold Lake regions. Numerals in parentheses refer to the legend on the map. Table 2.6. Alberta SCO and nonupgraded bitumen pipelines Name Destination Current capacity (10 3 m 3 /d) Cold Lake Area pipelines Cold Lake Heavy Oil Pipeline Hardisty 30.8 Cold Lake Heavy Oil Pipeline Edmonton 18.7 Husky Oil Pipeline Hardisty 21.2 Husky Oil Pipeline Lloydminster 36.0 Echo Pipeline Hardisty 12.0 Fort McMurray Area pipelines Athabasca Pipeline Hardisty 47.7 Terasen Pipelines (Corridor) Edmonton 44.2 Alberta Oil Sands Pipeline Edmonton 61.8 Oil Sands Pipeline Edmonton Existing Alberta Pipelines The Cold Lake pipeline system (1) is capable of delivering heavy crude from the Cold Lake area to Hardisty and Edmonton. The Husky pipeline (2) moves Cold Lake crude to Husky s heavy oil operations in Lloydminster. Heavy and synthetic crude is then transported to Husky s terminal facilities at Hardisty, where oil is delivered into the Enbridge (4) or the Express pipeline (5) systems. The Echo pipeline system (3) is an insulated pipeline able to handle high-temperature crude, thereby eliminating the requirement for diluent blending. This pipeline delivers Cold Lake crude to Hardisty. The Enbridge Pipeline (4), described below, is an existing export pipeline. The Kinder Morgan Express Pipeline (5), described below, is an existing export pipeline. The Athabasca pipeline (6) delivers semiprocessed product and bitumen blends to Hardisty and has the potential to carry m 3 /d. The Kinder Morgan Corridor pipeline (7) transports diluted bitumen from the Albian Sands mining project to the Shell Scotford upgrader. An expansion of the Corridor pipeline was completed in 2006, increasing capacity to m 3 /d by upgrading existing pump station facilities 2-22 EUB ST : Alberta s Energy Reserves 2006 and Supply/Demand Outlook / Crude Bitumen

 expansion project includes construction of a 42-inch diluted bitumen line, a")

69 The Alberta Oil Sands Pipeline (AOSPL) (8) is the exclusive transporter for Syncrude; an expansion to increase capacity to m 3 /d was completed in The Oil Sands Pipeline (9) transports Suncor synthetic oil to the Edmonton area Proposed Alberta Pipeline Projects The Kinder Morgan Corridor pipeline (7) expansion project includes construction of a 42-inch diluted bitumen line, a new 20-inch products pipeline, tankage, and upgrading existing pump stations along the existing pipeline from the Muskeg River mine to the Edmonton region. The expansion will increase diluted bitumen capacity to about m 3 /d by 2009 and will support further expansions beyond 2009 by adding intermediate pump stations. EUB ST : Alberta s Energy Reserves 2006 and Supply/Demand Outlook / Crude Bitumen 2-23
70 Construction of the Horizon Pipeline (10) began in November 2006 and is expected to be in service mid-2008, with an initial capacity of m 3 /d. Pembina Pipeline Corporation will complete the twinning of the existing AOSPL (8), resulting in two parallel, commercially segregated lines, one dedicated to Syncrude and the other to CNRL s new Horizon oil sands development. Also included is the construction of a new 48 km 20-inch pipeline from the Horizon site, 70 km north of Fort McMurray, to the AOSPL terminal. The Access Pipeline project (11) will transport diluted bitumen from the Christina Lake area to facilities in the Edmonton area. Access obtained approval from the EUB in December Initial capacity of the pipeline will be m 3 /d, expandable to m 3 /d. Construction of the pipeline is 99 per cent complete and start-up is expected early in Enbridge plans to construct the 390 km Waupisoo Pipeline (12) to move blended bitumen from the Cheecham Terminal, south of Fort McMurray, to the Edmonton area. Waupisoo is scheduled to be in service in mid-2008, with an initial capacity of m 3 /d, expandable to m 3 /d Existing Export Pipelines The Enbridge Pipeline, the world s longest crude oil and products pipeline system, delivers western Canadian crude oil to eastern Canada and the U.S. midwest. The Kinder Morgan Express pipeline begins at Hardisty and moves south to Casper, Wyoming, where it connects to the Platte pipeline, which extends into Wood River, Illinois. The pipeline capacity was increased to m 3 /d in early 2005 with an expansion that added new pump stations in Canada and the United States and new tankage facilities at Hardisty. The Kinder Morgan Trans Mountain pipeline system transports crude oil and refined products from Edmonton to marketing terminals and refineries in the Greater Vancouver area and Puget Sound in Washington State. Trans Mountain s current capacity is m 3 /d, assuming some shipments of heavy oil. Receipts of heavy crude at Edmonton have averaged some 20 per cent over the past two years. Pipeline capacity increases to m 3 /d, without heavy oil. Rangeland Pipeline is a gathering system that serves as another export route for Cold Lake Blend to Montana refineries. Milk River Pipeline delivers Bow River heavy and Manyberries light oil primarily into Montana refineries. Figure 2.13 shows the existing export pipelines leaving Alberta, in addition to the proposed expansions and new pipeline projects expected to transport the increased SCO and nonupgraded bitumen production to established and expanded markets. Table 2.7 lists the export pipelines, with their corresponding destinations and capacities EUB ST : Alberta s Energy Reserves 2006 and Supply/Demand Outlook / Crude Bitumen
 Enbridge Pipeline")

 British Columbia U.S. west coast Offshore 35.")
71 Table 2.7. Export pipelines Name Destination Capacity (10 3 m 3 /d) Enbridge Pipeline Kinder Morgan (Express) Eastern Canada U.S. east coast U.S. midwest U.S. Rocky Mountains U.S. midwest Milk River Pipeline U.S. Rocky Mountains 18.8 Rangeland Pipeline U.S. Rocky Mountains 13.5 Kinder Morgan (Trans Mountain) British Columbia U.S. west coast Offshore 35.8 Total EUB ST : Alberta s Energy Reserves 2006 and Supply/Demand Outlook / Crude Bitumen 2-25
72 Proposed Export Pipeline Projects Enbridge s Gateway Pipeline will consist of a 1150 km petroleum export line transporting m 3 /d of oil or blended bitumen and a m 3 /d condensate import line in the same right-of-way between Strathcona County and Kitimat, British Columbia. The proposed pipeline will provide access to the California and Asian markets and is expected to be in service in the 2012 to 2014 time frame. Kinder Morgan s Trans Mountain Expansion (TMX) project is proposed as a staged expansion of the existing Trans Mountain system between Edmonton and Burnaby (Vancouver) and/or Prince Rupert/Kitimat, British Columbia. The existing pipeline will be looped in stages to eventually create a dual pipeline system with an initial incremental capacity of m 3 /d, increasing to m 3 /d. The TMX1 Pump Station expansion is currently under construction and is expected to increase capacity by m 3 /d between Edmonton and Burnaby. The installation of new pump stations and the upgrading of existing facilities between Edmonton and Burnaby is expected to be completed by April The TMX1 Anchor Loop expansion involves looping a 160 kilometre section of the existing Trans Mountain pipeline system between Hinton, Alberta, and Jackman, British Columbia, and the addition of three new pump stations. With construction of the Anchor Loop, the system s capacity will increase to m 3 /d by the end of TransCanada PipeLine s Keystone Project proposes to convert a natural gas pipeline to crude oil service. The 1300 km of pipe to be converted originates near Hardisty, Alberta, and terminates at Oak Bluff, Manitoba. The project also includes construction of a 70 km pipeline to connect the Hardisty terminal with existing pipe, and an additional 1700 km will be built to connect Oak Bluff to Patoka, Illinois. The total length of proposed pipeline is 3000 km from Hardisty to Wood River and could be in service by 2010, with a capacity of m 3 /d. Enbridge s Southern Access Program includes an expansion component on the Canadian mainline and on the U.S. Lakehead System, which will result in increased capacity of m 3 /d. The Canadian expansion from Hardisty to the international border involves pump modification and tankage construction. Downstream of Superior, Wisconsin, the expansion includes optimization of existing facilities and a 42-inch pipeline to Flanagan, Illinois, built in two stages scheduled to be in service in 2008 and 2009 respectively. Altex, a newly formed Canadian company, intends to design, build, own, and operate the Altex Pipeline system. It will be a direct-route, standalone pipeline system from northern Alberta to the Gulf Coast, the largest oil refining market in North America. The pipeline will have an initial capacity of m 3 /d, expandable to m 3 /d, and could be in service by Enbridge recently announced the Alberta Clipper Pipeline, a proposed new 36-inch pipeline from Hardisty to Superior, where it will connect to the existing mainline system for deliveries into the U.S. midwest. This pipeline would be in addition to the Southern Access Program and have an initial capacity of m 3 /d, with start-up in late 2009 or EUB ST : Alberta s Energy Reserves 2006 and Supply/Demand Outlook / Crude Bitumen

73 2.2.4 Petroleum Coke Petroleum coke is a by-product of the oil sands upgrading process that is currently being stockpiled in huge amounts in Alberta. Petroleum coke produced in the delayed coking operation is considered a potential source of energy. It contains high sulphur but has lower ash than conventional fuel coke. It has the potential of becoming a future energy resource through a process called gasification and could possibly reduce the demand for natural gas. Suncor Energy Inc. and Syncrude Canada Ltd. operate Alberta s two largest oil sands mines near Fort McMurray. Complete with on-site extraction and upgrading capabilities, Syncrude and Suncor both produce coke but through different processes, which results in coke deposits with different ranges of particle size. Syncrude s coke is like coarse sand, while Suncor s is the size of gravel (or larger). Suncor has been burning sulphur-rich coke in its boilers for decades at its mine near Fort McMurray and is responsible for most of the total coke usage as a site fuel. Suncor has also been delivering small volumes of petroleum coke to Asian markets since 1997, mostly Japan, through its Energy Marketing Group. Syncrude began using coke as a site fuel in 1995 and accounts for a lower share of the total coke usage as a site fuel. Syncrude is looking for alternative uses for its coke surplus and is looking into way of using coke as a reclamation material. Statistics of petroleum coke inventories reported in the yearly ST43: Mineable Oil Sands Annual Statistics show consistent increases in the total closing inventories, except for a leveling in 1999 and 2000 due to oil sands operations, reaching 48 million tonnes in 2006, as shown in Figure EUB ST : Alberta s Energy Reserves 2006 and Supply/Demand Outlook / Crude Bitumen 2-27
74 2.2.5 Demand for Synthetic Crude Oil and Nonupgraded Bitumen Light sweet SCO has two principal advantages over light crude: it has very low sulphur content, and it produces very little heavy fuel oil. The latter property is particularly desirable in Alberta, where there is virtually no local market for heavy fuel oil. Among the disadvantages of SCO in conventional refineries are the low quality of distillate output, the need to limit SCO intake to a fraction of total crude requirements, and the high level of aromatics (benzene) that must be recovered. Overall demand for Alberta SCO and blended bitumen is influenced by many factors, including the price differential between light and heavy crude oil, expansion of refineries currently processing SCO and blended bitumen, altering the configuration of current light crude oil refineries, and the availability and price of diluent for shipping blended bitumen. Alberta oil refineries use SCO, bitumen, and other feedstocks to produce a wide variety of refined petroleum products. In 2006, five Alberta refineries, with a total capacity of m 3 /d, used m 3 /d of SCO and m 3 /d of nonupgraded bitumen. The Alberta refinery demand represents 31 per cent of Alberta SCO production and 4 per cent of nonupgraded bitumen production. Petro-Canada, in addition to the announced joint venture with UTS and Teck Cominco in the Fort Hills project, continues to reconfigure its Edmonton refinery to fully replace light-medium crude oil with SCO and nonupgraded bitumen by SCO is also used by the oil sands upgraders as fuel for their transportation needs and as plant fuel. Suncor reports that it sells bulk diesel fuel to companies that transport it to other markets in tanker trucks. Suncor also operates a Suncor Energy-branded cardlock station selling diesel fuel supplied from its oil sands operation. The station is located on Highway 63 north of Fort McMurray. In 2006, the sale of SCO as diesel fuel oil accounted for about 13 per cent of Alberta SCO demand. Figure 2.15 shows that in 2016 Alberta demand for SCO and nonupgraded bitumen will increase to about m 3 /d. It is projected that SCO will account for 87 per cent of total Alberta demand and nonupgraded bitumen will account for 13 per cent. Given the current quality of SCO, western Canada s nine refineries, with a total capacity of m 3 /d, are able to blend up to 35 per cent SCO and a further 4 per cent of blended bitumen with crude oil. These refineries receive SCO from both Alberta and Saskatchewan. In eastern Canada, the four Sarnia-area refineries, with a combined total capacity of m 3 /d, are the sole ex-alberta Canadian market for Alberta SCO. Demand for Alberta SCO will come primarily from existing markets vacated by declining light crude supplies, as well as increased markets for the future growth of refined products. The largest export markets for Alberta SCO and nonupgraded bitumen are the U.S. midwest, with a refining capacity of m 3 /d, and the U.S. Rocky Mountain region, with a refining capacity of m 3 /d. The refineries in these areas are capable of absorbing a substantial increase in supplies of SCO and nonupgraded bitumen from Alberta. Other potential market regions could be the U.S. east coast, with a refining capacity of m 3 /d, the U.S. Gulf Coast, with a refining capacity of m 3 /d, the U.S. west coast, with a refining capacity of m 3 /d, and Asia EUB ST : Alberta s Energy Reserves 2006 and Supply/Demand Outlook / Crude Bitumen


75 The traditional markets for Alberta SCO and nonupgraded bitumen are expanding. These include western Canada, Ontario, the U.S. midwest, the northern Rocky Mountain region, and the U.S. west coast (Washington State). In March 2006, Enbridge announced that the first western Canadian crude oil was delivered through its Spearhead pipeline to Cushing, Oklahoma. The oil being delivered to Cushing travels through the Enbridge mainline system from Edmonton to Chicago, 2519 km, before entering Spearhead for the final 1046 km to Cushing. Shipments on the m 3 /d capacity pipeline have increased steadily, with nominations exceeding capacity in the fourth quarter of Enbridge is currently in the process of evaluating the potential to expand the Spearhead pipeline by m 3 /d. Markets were further expanded in April 2006 with the reversal of an ExxonMobil Corporation pipeline that moves oil from Patoka, Illinois, to Beaumont/Nederland, Texas. Canadian crude can access the line via the Enbridge mainline and Lakehead systems and then the Mustang Pipeline or the Kinder Morgan Express-Platte Pipeline system. ExxonMobil expects the pipeline will operate at its estimated capacity of m 3 /d in heavy crude service. The Spearhead pipeline and the ExxonMobil pipeline are shown in Figure As illustrated in Figure 2.15, over the forecast period SCO removals from Alberta will increase from m 3 /d to m 3 /d, and the removals of nonupgraded bitumen will increase from m 3 /d to m 3 /d. EUB ST : Alberta s Energy Reserves 2006 and Supply/Demand Outlook / Crude Bitumen 2-29
76
77 3 Crude Oil 3.1 Reserves of Crude Oil Provincial Summary The EUB estimates the remaining established reserves of conventional crude oil in Alberta to be million cubic metres (10 6 m 3 ) at December 31, This is a net decrease of m 3, or 1.9 per cent, from December 31, 2005, resulting from all reserve adjustments and production, as well as additions that occurred during The changes in reserves and cumulative production for light-medium and heavy crude oil to December 31, 2006, are shown in Table 3.1. Figure 3.1 shows that compared to 1990, the province s remaining conventional oil reserves have declined by more than half. Remaining reserves now stand at 20 per cent of the peak reserves of m 3 reported in Table 3.1. Reserve change highlights (10 6 m 3 ) Change Initial established reserves a Light-medium Heavy Total Cumulative production a Light-medium b Heavy b Total b ( bbls) Remaining established reserves a Light-medium Heavy Total ( bbls) a Discrepancies are due to rounding. b May differ from annual production Reserves Growth A detailed pool-by-pool listing of reservoir parameters and reserves data is available on CD (see Appendix C). Table 3.2 gives a detailed breakdown of this year s reserves changes, including additions, revisions, and enhanced recovery, while Figure 3.2 gives a history of these changes back to The initial established reserves attributed to the 495 new oil pools booked in 2006 totaled m 3 (an average of 16 thousand [10 3 ] m 3 per pool), up from m 3 in Reserve additions from new waterfloods increased from m 3 to m 3 (Figure 3.3). Net reserve revisions totalled m 3. The resulting total increase in initial established reserves for 2006 amounted to m 3, compared to last year s m 3. Table B.3 in Appendix B provides a history of conventional oil reserve growth and cumulative production starting in EUB ST : Alberta s Reserves 2006 and Supply/Demand Outlook / Crude Oil 3-1
 Light-medium Heavy Total New discoveries 7.")

78 Reserve additions resulting from drilling and new enhanced recovery schemes amounted to m 3, up from m 3 the year before. These additions replaced 79 per cent of Alberta s 2006 conventional crude oil production of m 3, significantly up from last year s 60 per cent replacement. Table 3.2. Breakdown of changes in crude oil initial established reserves a (10 6 m 3 ) Light-medium Heavy Total New discoveries Development of existing pools Enhanced recovery (new/expansion) Revisions Total a a Discrepancies are due to rounding Oil Pool Size At December 31, 2006, oil reserves were assigned to 9166 light-medium and 2697 heavy crude oil pools in the province, most of which consist of a single well. The distribution of reserves by pool size shown in Figure 3.4 indicates that some 63 per cent of the province s remaining oil reserves is contained in the largest 3 per cent of pools, and 95 per cent of those reserves were discovered before By contrast, the smallest 74 per cent of pools contain only 6 per cent of its remaining reserves. Figure 3.5 illustrates the historical trends in the size of oil pools. 3-2 EUB ST : Alberta s Reserves 2006 and Supply/Demand Outlook / Crude Oil

79 EUB ST : Alberta s Reserves 2006 and Supply/Demand Outlook / Crude Oil 3-3
, the average has declined from 150 10 3 m")


80 While the median pool size has remained fairly constant over time (below m 3 initial established reserves per pool), the average has declined from m 3 in 1970 to about m 3 over the last few years. The Valhalla Doe Creek I and Dunvegan B Pool discovered in 1977 is the last major (over m 3 ) oil discovery in Alberta. Its initial established reserve is estimated at m EUB ST : Alberta s Reserves 2006 and Supply/Demand Outlook / Crude Oil


81 3.1.4 Pools with Largest Reserve Changes Some 1900 oil pools had their reserves changed over the past year, for a net total revision of plus m 3. Table 3.3 lists those pools having the largest reserve changes in Pool development in the Turner Valley Rundle Pool saw a significant increase of m 3. Reassessment of the primary reserves in the Hayter Dina B and Suffield Upper Mannville A Pool resulted in an increase of 1524 and m 3 respectively. Review of the Simonette Beaverhill Lake A waterflood resulted in a reserve write-down of m 3. Continued exploration in the Pembina area since 1994 has resulted in the discovery of many off-reef Nisku pools. In 2006, initial established reserves in the play area totalled about m 3, the largest being the Pembina Nisku II Pool, with initial reserves of m Distribution by Recovery Mechanism The distribution of conventional crude oil reserves by recovery mechanism is illustrated in Figure 3.6. It shows that waterflooding has increased recovery in light-medium pools by an average 13 per cent. Table 3.4 shows reserves broken down by recovery mechanism. Primary recovery for heavy crude pools has increased from 8 per cent in 1990 to 12 per cent in 2006 due to improvements in water handling, horizontal wells, and increased drilling density. Incremental recovery from all waterflood projects represents about 26 per cent of the province s initial established reserves. Pools under solvent flood added another 4 per cent to the province s reserves and on average realized a 24 per cent improvement in recovery efficiency over primary. This year saw the first tertiary scheme in a heavy crude pool, a polymer flood in the Taber South Mannville B Pool. It is expected to contribute m 3 (incremental 5 per cent recovery factor) for a total initial established reserve of m 3. EUB ST : Alberta s Reserves 2006 and Supply/Demand Outlook / Crude Oil 3-5
82 Table 3.3. Major oil reserve changes, 2006 Initial established reserves (10 3 m 3 ) Pool 2006 Change Main reason for change Bow Island Sawtooth D Pool development Caroline Rundle A Pool development and reassessment of waterflood Cordel Cardium B Reassessment of primary reserves Dixonville Montney C Pool development Ferrier Belly R Q, Cardium G & L Reassessment of waterflood reserves Gift Slave Point A Reassessment of waterflood reserves Hayter Dina B Reassessment of primary reserves Joarcan Viking Reassessment of primary reserves Kavbob Beaverhill Lake A Reassessment of waterflood reserves Kleskun Beaverhill Lake A Pool development Little Bow Upper Mannville I Reassessment of waterflood reserves Lloydminster Lloydminster F Pool development Loon Slave Point G Reassessment of reserves Morgan Spky A, Lloyd A Rex A & Dina B Pool development Pouce Coupe South Boundary B Reassessment of waterflood reserves Progress Halfway B Reassessment of primary reserves Provost Upper Mannville T8T Reassessment of primary reserves Simonette Beaverhill Lake A Reassessment of reserves Suffield Upper Mannville A Reassessment of primary reserves Swan Hills South Beaverhill Lake A & B Reassessment of primary reserves Taber South Mannville B Recognition of tertiary scheme Turner Valley Rundle Pool development Valhalla Doe Creek I& Dunvegan B Reassessment of waterflood reserves Wildmere Lloydminster C Pool development Willesden Green BR, Card, Vik MU# Reassessment of waterflood reserves 3-6 EUB ST : Alberta s Reserves 2006 and Supply/Demand Outlook / Crude Oil
83 Table 3.4. Conventional crude oil reserves by recovery mechanism as of December 31, 2006 Initial volume Initial established reserves (10 6 m 3 ) Average recovery (%) Crude oil type and pool type in place (10 6 m 3 ) Primary Waterflood/ gas flood Solvent flood Total Primary Waterflood/ gas flood Solvent flood Total Light-medium Primary depletion Waterflood Solvent flood Gas flood Heavy Primary depletion Waterflood Total Percentage of total initial established reserves 71% 25% 4% 100% Distribution by Geological Formation The distribution of reserves by geological period and PSAC area is depicted graphically in Figure 3.7 and Figure 3.8 respectively. About 37 per cent of remaining established reserves are expected to come from formations within the Lower Cretaceous, 21 per cent from the Upper Devonian, and 18 per cent from Upper Cretaceous. This contrasts with 1990, when 30 per cent of remaining reserves were expected to be recovered from the Upper Devonian and only 16 per cent from the Lower Cretaceous. The shallower zones of the Lower Cretaceous are important as a source of future conventional oil. A detailed breakdown of reserves by geological period and formation is presented in tabular form in Appendix B, Tables B.4 and B Ultimate Potential The ultimate potential of conventional crude oil was estimated by the EUB in 1994 at m 3, reflecting its estimate of geological prospects. Figure 3.9 illustrates the historical relationship between remaining reserves and cumulative oil production. Extrapolation of the decline seems to suggest that the EUB s estimate of ultimate potential may be slightly low. However, a few more years of data are needed to better define the trend before initiating a new update to the ultimate potential. Figure 3.10 shows Alberta s historical and forecast growth of initial established reserves. About 79 per cent of the estimated ultimate potential for conventional crude oil has been produced to December 31, Known discoveries represent 87 per cent of the ultimate potential, leaving 13 per cent ( m 3 ) of the ultimate potential yet to be discovered. This added to remaining established reserves means that m 3 of conventional crude oil is available for future production. EUB ST : Alberta s Reserves 2006 and Supply/Demand Outlook / Crude Oil 3-7

84 3-8 EUB ST : Alberta s Reserves 2006 and Supply/Demand Outlook / Crude Oil


85 While remaining reserves and production of crude oil continue to decline, there are m 3 yet to be discovered, which at the five-year average growth rate of m 3 per year will take over 22 years to find. The discovery of new pools and development of existing pools will continue to bring on new reserves and associated production each year. EUB ST : Alberta s Reserves 2006 and Supply/Demand Outlook / Crude Oil 3-9

86 Any future decline in conventional crude oil production will be more than offset by increases in crude bitumen and synthetic production (see Section 2.2). 3.2 Supply of and Demand for Crude Oil In projecting crude oil production, the EUB considers two components: expected crude oil production from existing wells at year-end and expected production from new wells. Total production of crude oil is the sum of these two components. Demand for crude oil in Alberta is based on refinery capacity and utilization. Alberta crude oil supply in excess of Alberta demand is removed from the province Crude Oil Supply Since the early 1970s, production of Alberta light-medium and heavy crude oils has been on a downward trend. In 2006, total crude oil production declined to m 3 /day. Light-medium crude oil production declined by about 4 per cent to m 3 /d from its 2005 level, while heavy crude oil production experienced a decline of about 7 per cent to m 3 /d. This resulted in an overall decline in total crude oil production of 5 per cent from 2005 to 2006 and is consistent with the decline from 2004 to In 2006, 2146 successful oil wells were drilled, a decrease of some 1 per cent over Figure 3.11 shows the number of successful oil wells drilled in Alberta in 2005 and 2006 by geographical area (modified PSAC area). The majority of oil drilling in 2006, nearly 72 per cent, was development drilling. As shown in the figure, major changes in drilling levels were seen in PSAC 4 (East Central Alberta), with an increase of 27 per cent, and PSAC 3 (Southeastern Alberta), with a decrease of 19 per cent EUB ST : Alberta s Reserves 2006 and Supply/Demand Outlook / Crude Oil
87 Figure 3.12 depicts the distribution of new crude oil wells placed on production and Figure 3.13 shows the initial operating day rates of new wells in In the past few years the number of oil wells placed on production in a given year has tended to be lower than crude oil well drilling activity. Oil well drilling statistics are based on the predicted well status from the well licence. Once the well goes on production, the company submits a fluid status for the specific producing event, which may differ from the predicted code, causing the oil well connections to be consistently less than the oil well drilling activity. The majority of these changes occur in moving from a predicted well status of oil to a producing event of gas. In 2006, actual wells placed on production increased by 4 per cent over 2005 levels. Historical oil production by geographical area is illustrated in Figure Most areas experienced declines in production, ranging from 4.0 per cent in PSAC 8 (Northwest Alberta) to 9.4 per cent in PSAC 3 (Southeastern Alberta). The two exceptions were PSAC 1 (Foothills), with an increase in production of 29.5 per cent, and PSAC 2 (Foothills Front), with the production level consistent with that of Annual EUB drilling statistics indicate that except for 1999 and 2002, the number of crude oil producing wells has increased over time. In contrast, crude oil production has been on decline since its peak of m3 /d in Figure 3.15 shows total crude oil production and the number of crude oil producing wells since As it illustrates, while the total number of producing wells has increased from 9900 in 1973 to in 2006, crude oil production has been on decline. Of the wells producing oil in 2006, about 2700 were classified as gas wells. Although these gas wells represented 7 per cent of wells that produced oil, they produced at an average rate of only 0.3 m3/d and accounted for less than 1 per cent of the total production. EUB ST : Alberta s Reserves 2006 and Supply/Demand Outlook / Crude Oil 3-11


88 3-12 EUB ST : Alberta s Reserves 2006 and Supply/Demand Outlook / Crude Oil

89 The average well productivity of crude oil producing wells in 2006 was 2.3 m 3 /d. The majority of crude oil wells in Alberta, about 61 per cent, produced less than 2 m 3 /d per well. In 2006, the oil wells in this category operated at an average rate of 1 m 3 /d and accounted for only 20 per cent of the total crude oil produced. Figure 3.16 depicts the distribution of crude oil producing wells based on their average production rates in EUB ST : Alberta s Reserves 2006 and Supply/Demand Outlook / Crude Oil 3-13


90 In 2006, some 295 horizontal wells were brought on production, an 8 per cent decrease from 2005, raising the total to 3650 producing horizontal oil wells in Alberta. Horizontal wells accounted for 10 per cent of producing oil wells and about 17 per cent of the total crude oil production. Production from horizontal wells drilled in the past ten years peaked in 1999 at an average rate of 13.0 m 3 /d. The current production rate of new horizontal wells averaged about 7.3 m 3 /d. In projecting crude oil production, the EUB considered two components: expected crude oil production from existing wells at 2006 year-end and expected production from new wells. Total production of crude oil is the sum of these two components. To project crude oil production from the wells drilled prior to 2007, the EUB considered the following assumptions: Production from existing wells in 2007 will be m 3 /d. Production from existing wells will decline at a rate of about 16 per cent per year. Crude oil production from existing wells by year placed on production over the period is depicted in Figure This figure illustrates that about 35 per cent of crude oil production in 2006 resulted from wells placed on production in the last five years. Over the forecast period, production of crude oil from existing wells is expected to decline to m 3 /d by Figure 3.18 compares Alberta crude oil production with crude oil production from Texas onshore and Louisiana onshore from 1950 through Louisiana onshore production peaked in 1970, while Texas onshore production peaked in 1972 and Alberta production peaked in The figure shows that Alberta did not experience the same steep decline rates after reaching peak production as did Texas and Louisiana. This difference may be attributed in part to the crude oil prorationing system that existed in Alberta from the 3-14 EUB ST : Alberta s Reserves 2006 and Supply/Demand Outlook / Crude Oil


91 early 1950s through the mid-1980s. Within this period, due to lack of sufficient markets for Alberta crude oil, production was curtailed to levels below the production capacity, which in turn resulted in a slower decline after its peak in Total production from new wells is a function of the number of new wells that will be drilled successfully, initial production rate, and the decline rate for these new wells. The EUB projects that global crude oil prices will play a role in drilling activity over the forecast period. As discussed in Section 1, the EUB expects that crude oil prices will remain above historic levels. However, crude oil drilling is not expected to return to the record highs of the mid-1990s, because of the mature nature of conventional oil development in the province. Industry has turned its focus to natural gas drilling and oil sands development. To project crude oil production from new wells, the EUB considered the following assumptions: The number of new oil wells placed on production is projected to increase to 2000 wells in 2007 and remain at this level over the forecast period. Figure 3.19 illustrates the EUB s forecast for wells placed on production for the period 2007 to New well productivities have declined over time and averaged 8.0 m 3 /d/well in the mid-1990s. Based on recent history, it is expected that the average initial production rate for new wells will be 5 m 3 /d/well and will decrease to 3.5 m 3 /d/well by the end of the forecast period. Production from new wells will decline at a rate of 28 per cent the first year, 24 per cent the second and third year, 20 per cent the fourth year, 17 per cent for the remaining forecast period. EUB ST : Alberta s Reserves 2006 and Supply/Demand Outlook / Crude Oil 3-15


92 The projection of the above two components, production from existing wells and production from new oil wells, is illustrated in Figure Light-medium crude oil production is expected to decline from m 3 /d in 2006 to m 3 /d in EUB ST : Alberta s Reserves 2006 and Supply/Demand Outlook / Crude Oil
93 Although crude oil wells placed on production are expected to continue at about 2000 wells per year, light-medium crude oil production will continue to decline by almost 5 per cent per year, due to the failure of new well production to offset declining production from existing wells. New drilling has been finding smaller reserves over time, as would be expected in a mature basin. Over the forecast period, heavy crude production is also expected to decrease, from m 3 /d in 2006 to m 3 /d by the end of the forecast period. Figure 3.20 illustrates that by 2016, heavy crude oil production will constitute a greater portion of total production compared to The combined EUB forecasts from existing and future wells indicate that total crude oil production will decline from m 3 /d in 2006 to m 3 /d in By 2016, if crude oil production follows the projection, Alberta will have produced about 87 per cent of the estimated ultimate potential of m Crude Oil Demand Oil refineries use mainly crude oil, butanes, and natural gas as feedstock, along with synthetic crude oil (SCO), bitumen, and pentanes plus, to produce a wide variety of refined petroleum products (RPPs). The key determinants of crude oil feedstock requirements for Alberta refineries are domestic demand for RPPs, shipments to other western Canadian provinces, exports to the United States, and competition from other feedstocks. Since Alberta is a swing supplier of RPPs within western Canada, a refinery closure or expansion in this market may have a significant impact on the demand for Alberta RPPs and, hence, on Alberta crude oil feedstock requirements. In 2006, Alberta refineries, with total inlet capacity of m 3 /d of crude oil and equivalent, processed m 3 /d of crude oil. SCO, bitumen, and pentanes plus constituted the remaining feedstock. Crude oil accounted for roughly 45 per cent of the total crude oil and equivalent feedstock (see Section 2.2.4). Figure 3.21 illustrates the capacity and location of Alberta refineries. It is expected that no new crude oil refining capacity will be added over the forecast period. Refinery utilization for 2006 was about 89 per cent and is expected to remain at or above this level, as demand for refined petroleum products increases in western Canada. Total crude oil use will reach m 3 /d in 2007, declining to m 3 /d in 2008, with a further decline to m 3 /d for the remainder of the forecast period. This decline is the result of the Petro-Canada Refinery Conversion project set to fully replace light-medium crude oil with SCO and nonupgraded bitumen by Shipments of crude oil outside of Alberta, depicted in Figure 3.22, amounted to 65 per cent of total production in With the decline in demand for light-medium crude in Alberta, the EUB expects that by 2016 about 59 per cent of production will be removed from the province. EUB ST : Alberta s Reserves 2006 and Supply/Demand Outlook / Crude Oil 3-17

94 3-18 EUB ST : Alberta s Reserves 2006 and Supply/Demand Outlook / Crude Oil


95 3.2.3 Crude Oil and Equivalent Supply Figure 3.23 shows crude oil and equivalent supply. It illustrates that total Alberta crude oil and equivalent is expected to increase from m 3 /d in 2006 to m 3 /d in Over the forecast period, as illustrated in Figure 3.24, the growth in production of nonupgraded bitumen and SCO is expected to significantly offset the decline in conventional crude oil. The share of SCO and nonupgraded bitumen will account for some 86 per cent of total production by EUB ST : Alberta s Reserves 2006 and Supply/Demand Outlook / Crude Oil 3-19
96
97 4 Coalbed Methane Coalbed methane (CBM), also known as natural gas from coal (NGC), is the methane gas found in coal, both as adsorbed gas and as free gas. All coal seams contain CBM to some extent and each individual seam is potentially capable of producing some quantity of CBM. For this reason, coal and CBM have a fundamental relationship. Coal is known, from thousands of coalholes and oil and gas wells, to underlie most of central and southern Alberta. Individual coal seams are grouped into coal zones, which can be correlated very well over regional distances. The first production of CBM in Alberta was attempted in the 1970s, but the first CBM pool was not defined by the EUB until Significant development with commercial production commenced in early Interest in CBM development in Alberta continues to grow, with ongoing high numbers of CBM completions. The actual CBM production to date continues to remain uncertain because of the current inability to differentiate CBM from conventional gas production where commingled production occurs. New regulations were implemented on October 31, 2006, to assist in appropriate data collection for CBM. As additional data through these requirements become available, the accuracy of CBM production estimates is expected to improve. CBM zones are known to be laterally extensive over regional distances, but the values of reservoir parameters are generally limited to a more localized scale. CBM pools consist of several individual producing coal seams considered as one pool for administrative purposes. The current definition of a CBM pool is that of a CBM zone constrained within a gas field boundary. A CBM zone is defined as all coals within a formation unless separated by more than 30 m of non-coal-bearing strata or separated by a previously defined conventional gas pool. 4.1 Reserves of CBM Provincial Summary The EUB estimates the remaining established reserves of CBM to be 24.7 billion cubic metres (10 9 m 3 ) as of December 31, 2006, in areas of Alberta where commercial production is occurring. The gas produced from coals in Alberta consists primarily of methane (usually about 95 per cent), with very little natural gas liquids. The heating value of CBM is usually about 37 megajoules/m 3. A summary of reserves is shown in Table 4.1. In 2006, the annual production from all wells listed as CBM (see EUB Bulletin ) was m 3, but this includes some wells marked as CBM that do not have completions in coal or recompleted wells with no production separation by event. The production of CBM only from these wells is considered to be m 3, slightly more than 25 per cent of the commingled flow. Table 4.1. Changes in CBM reserves, 2006 (10 9 m 3 ) Change Initial established reserves Cumulative production Remaining established reserves EUB ST : Alberta s Reserves 2006 and Supply/Demand Outlook / Coalbed Methane 4-1
98 4.1.2 Detail of CBM Reserves Exploration and development drilling is being conducted for CBM across wide areas of Alberta and in many different horizons. The first commercial production and reserves estimates were for the Horseshoe Canyon coals, which are mainly gas-charged, with little or no pumping of water required. This remains the main focus of industry and currently has the highest established reserves. Additional data have been collected under new regulations (implemented October 2006), which has resulted in a more accurate production split of commingled wells. For some fields, this reassessed production split resulted in lower production in 2006 than in previous years. The production split was not reassessed for previous years. Production of CBM from the Ardley coals is limited but is anticipated to increase in coming years. In 2005, the first commercial success was announced for Mannville CBM production in the Corbett/Thunder and Doris fields. In these fields, CBM production requires the disposal of saline water. Mannville CBM reserves were reported for the first time in 2005 and are now included in this report in Appendix B, Table B.6. Remaining reserves for all formations have been calculated using a deposit block model method. This yields a remaining established reserve of m 3, as shown in Table B.6. The Mannville CBM play has increased in activity, but there are no indications of largescale development at this time. For this reason, there have been additional fields added to Appendix B, Table B.7, but no additional reserves have been determined. Current industry practice suggests that long-term CBM production from the Mannville and Ardley will be project-style developments combining recompletions of existing conventional wells with the drilling of new CBM wells. In other regions of the province, active exploration and pilot programs of various sizes are currently testing CBM production, but these have no commercial gas production. Table B.7 lists production from these areas, but reserves have not been booked pending commercial production. Note that many fields are still at initial stages of exploration, and there are very few data to calculate CBM reserves. Once more data are collected, the reserves should increase. The m 3 initial in-place volume (Table B.6) encompasses the areas of commercial CBM production. This volume is expected to increase with further evaluation to include areas of known resources drilled but not yet producing. The remaining established reserves is set at m 3, based on Table B Commingling of CBM with Conventional Gas Commingling is the unsegregated production of gas from more than one interval in a wellbore. In the case of CBM, this includes CBM/CBM and CBM/conventional gas. The former case does not affect the calculation of CBM reserves, but the latter case does complicate the calculation of remaining reserves. In several areas, CBM production has been commingled with conventional gas. CBM production from the generally wet CBM formations of the Scollard, Mannville, and Kootenay coal-bearing formations is not currently being approved for commingling with gas from other lithologies because of the potential negative impact of water production on CBM recovery and mixing of water between aquifers. As the Horseshoe Canyon and Belly River CBM pools are generally dry CBM, with little or no pumping of water required, the commingling of CBM and other conventional gas pools is becoming fairly common (CBM/conventional commingling). Because many 4-2 EUB ST : Alberta s Reserves 2006 and Supply/Demand Outlook / Coalbed Methane
99 of the sandstone gas reservoirs in these strata may be marginally economic or uneconomic if produced separately, commingling with CBM can be beneficial from a resource conservation perspective. As changes to the commingling requirements were implemented in 2006, there is now an area of central Alberta called Development Entity #1 that is approved for this type of production (see Figure 4.1). In some circumstances, commingling can have the additional benefit of minimizing surface impact by reducing the number of wells needed to extract the same resource. However, CBM/conventional commingling creates lack of segregated data, thereby affecting reserves calculations. Many wells report only large CBM production, even though analysis of the well indicates that there is unsegregated production of both CBM and conventional gas. Recompleted wells with new CBM production may not report to a separate production occurrence. To address these data constraints in this report, the following analysis was completed on wells with commingled production: The completions were checked for most wells, and ones found to be only in coal were assigned as CBM-only production. CBM production from commingled CBM/sandstone wells is interpolated from CBM control wells. The volume of CBM production was then subtracted from the total volume to give the conventional gas production. CBM production from conventional wells recompleted for CBM and not reported separately was not included. In future, these wells will be subject to a reporting audit. This process resulted in the contribution of CBM production being reduced in a few fields, as summarized in Table B.6. The Oil and Gas Conservation Regulations now stipulate data submission requirements for control wells to capture information on CBMonly production characteristics. Future submission of these test results will allow for more complete analysis to improve allocation of production in commingled wells Distribution of Production by Geologic Strata The following horizons have CBM potential in the Alberta plains: Ardley Coals of the Scollard Formation This is the upper set of coals, which are generally the shallowest, with varying gas contents and quantities of water. These coals continue to the west, outcropping in the Alberta Foothills, where they are referred to as the Coalspur coals. Where water is present, it is usually nonsaline or marginally saline, and thus water production and disposal must comply with the Water Act. Coals of the Horseshoe Canyon Formation and Belly River Group This is the middle set of coals, which generally have low gas content and low water volumes, with production referred to as dry CBM. The first commercial production of CBM in Alberta was from these coals, the main set of coals to have CBM reserves booked at this time. Coals of the Mannville Group This is the lower set of coals, primarily in the Upper Mannville Formation(s). These generally have high gas content and high volumes of saline water, which require extensive pumping and water disposal. These coals continue to the west to outcrop near the Rocky Mountains, where they are referred to as the Luscar coals. Mannville coals are the focus of a number of pilot projects, one of which declared commercial success. This successful pilot expanded into two gas fields. A few of the pilots have been abandoned (e.g., Fenn Big Valley). The initial reserves for other areas within the Mannville have been set at cumulative production. EUB ST : Alberta s Reserves 2006 and Supply/Demand Outlook / Coalbed Methane 4-3


100 4-4 EUB ST : Alberta s Reserves 2006 and Supply/Demand Outlook / Coalbed Methane
101 Kootenay Coals of the Mist Mountain Formation These coals are only present in the foothills of southwestern Alberta. They have varying gas content and quantities of water, but production of gas is very low due to tectonic disruption. No reserves have been calculated Hydrogen Sulphide Content Hydrogen sulphide (H 2 S) is not normally considered to be an issue with respect to CBM, as the coal adsorption coefficient for H 2 S is far greater than for methane. However, commingling CBM production with conventional sandstone gas from the Upper Cretaceous may result in trace amounts of H 2 S being produced Reserves Determination Method All calculations for this report used a three-dimensional deposit block model. CBM exists as deposits (similar to coal and bitumen) of disseminated gas, with gas content and reserve values that can be calculated using a deposit model. As CBM is natural gas, it is regulated and administered as if it existed in pools, but the pool resource and reserve calculation method is not directly applicable. Analysis of the Upper Cretaceous dry CBM trend, where most CBM pools are geologically distinct and show different pressure gradients, concludes that it is more appropriate to use separate gas content formulas for each CBM pool. Where block modelling has been done, information on the gas content of coals, while still quite limited, does indicate that a reliable relationship exists among gas content, formation pressure, depth from surface, and ash content of the coal. The CBM deposit block models were constructed by developing a three-dimensional gridded seam model, with subsequent application of measured gas content and recovery factors to each coal block. Production flow logs and other criteria indicate that the individual block recovery factors need to be assigned on a different basis for each coal seam. Coals shown not to produce any gas have their recovery factor set to zero. The results are highly varied from gas field to gas field, and some areas have no or limited useful data, while other fields have good information. CBM data are available on two systems at the EUB: summarized pool style net pay data on the Basic Well Database and individual coal seam thickness picks on the Coal Hole Database. For further information, contact EUB Information Services Ultimate Potential As the thickness and correlatability of coal as a host rock can be determined from the large number of available oil and gas wells, the EUB believes that a regional estimation of CBM resources can be established with some degree of confidence. In 2003, the Alberta Geological Survey, in Earth Sciences Bulletin , estimated that there are some 14 trillion m 3 (500 trillion cubic feet) of gas in place within all of the coal in Alberta, as summarized in Table 4.2. Only a very small portion of that coal resource has been studied in detail for this report. The geographic distribution of these resources is shown in Figure 4.2. EUB ST : Alberta s Reserves 2006 and Supply/Demand Outlook / Coalbed Methane 4-5


102 Table 4.2. CBM resources gas-in-place summary constrained potential (depth and thickness restrictions)* (10 6 m 3 ) m 3 TCF Upper Cretaceous/ Tertiary - Plains Mannville coals Foothills / Mountains Total *AGS Earth Sciences Bulletin EUB ST : Alberta s Reserves 2006 and Supply/Demand Outlook / Coalbed Methane

103 4.2 Supply of and Demand for Coalbed Methane As mentioned previously, commercial production of CBM in Alberta began in 2002, with small volumes recovered to date. In 2006, m 3 was produced, mostly from the CBM wells of the dry coals and commingled sandstones of the Horseshoe Canyon Formation. Commercial production from the Mannville Group is in its infancy, and much of the success to date has come as a result of horizontal drilling. CBM has the potential to become a significant supply source in Alberta over the next 10 years. In 2006, 2434 wells, similar to the revised well count for 2005, were connected for CBM production in the province. Roughly 25 per cent of the wells were classified by the operators as conventional gas wells but were deemed to be CBM producing wells by the EUB. Figure 4.3 illustrates the location of CBM wells by geographical area. A large portion of the well connections have been in Central Alberta (PSAC Area 5) and Southeastern Alberta (PSAC Area 3), accounting for 47 and 42 per cent respectively of all CBM wells connected in Future drilling and CBM connections are expected to continue to be significant in the Horseshoe Canyon Formation in areas of Southeastern and Central Alberta. Conventional supply will be commingled with CBM production in the same wellbore where deemed appropriate. In projecting CBM production, the EUB considered expected production from existing wells and expected production from new well connections. Limited historical production data suggest that CBM production does not behave in the same manner as conventional production in that CBM production declines more slowly. EUB ST : Alberta s Reserves 2006 and Supply/Demand Outlook / Coalbed Methane 4-7

104 To project production from new CBM well connections, the EUB considered the following assumptions: The average initial productivity of new CBM connections will be m 3 /d. Production from new well connections will decline by 15 per cent after the first full year of production and then decline by 10 per cent per year. CBM well connections are expected to decline in 2007 to 1900 wells. The commodity price declines that took place in late 2006 are responsible for a slowdown in CBM and shallow conventional gas drilling, which is expected to continue well into In 2008 and 2009, some 2400 wells are forecast to be connected annually, increasing to 2500 wells in 2010 and thereafter for the remainder of the forecast period. The well connection numbers are lower than last year s forecast due to lower than expected economic return for CBM. Based on the assumptions described above, the EUB generated the forecast of CBM production to 2016, as shown in Figure 4.4. The production of CBM is expected to increase from m 3 in 2006 to m 3 in This represents an increase from 3 per cent in 2006 to about 13 per cent in 2016 of total Alberta marketable gas production. Gas production from CBM may be higher than that forecast if commercial production of gas from the Mannville coal seams is accelerated. See Section 5 for a further discussion of Alberta natural gas supply and demand. 4-8 EUB ST : Alberta s Reserves 2006 and Supply/Demand Outlook / Coalbed Methane
105 5 Conventional Natural Gas Raw natural gas consists mostly of methane and other hydrocarbon gases, but also contains other nonhydrocarbons, such as nitrogen, carbon dioxide, and hydrogen sulphide. These impurities typically make up less than 10 per cent of raw natural gas. The estimated average composition of the hydrocarbon component after removal of impurities is about 91 per cent methane, 5 per cent ethane, and lesser amounts of propane, butanes, and pentanes plus. Ethane and higher paraffin hydrocarbon components, which condense into liquid at different temperature and pressure, are classified as natural gas liquids (NGLs) in this report. 5.1 Reserves of Natural Gas Provincial Summary At December 31, 2006, the EUB estimates the remaining established reserves of marketable gas in Alberta to be billion cubic metres (10 9 m 3 ), having a total energy content of 40.2 exajoules. This decrease of m 3 since December 31, 2005, is the result of all reserves additions less production that occurred during These reserves exclude 35.4 million 10 9 m 3 of ethane and other NGLs, which are present in marketable gas leaving the field plant and are subsequently recovered at straddle plants, as discussed in Section Removal of NGLs results in a 4.4 per cent reduction in average heating value from 39 megajoules (MJ)/m 3 to 37.3 MJ/m 3 for gas downstream of straddle plants. Details of the changes in remaining reserves during 2006 are shown in Table 5.1. Total provincial gas in place and raw producible gas for 2006 is m 3 and m 3 respectively. This gives an average provincial recovery factor of 69 per cent. An average provincial surface loss of 15.3 per cent is applied to the raw producible gas to yield initial established marketable reserves of m 3, as shown in Table 5.1. This surface loss estimation is discussed in Section Detailed pool-by-pool reserves data are available on CD. See Appendix C. Table 5.1. Highlights of marketable gas reserve changes (10 9 m 3 ) Gross heating 2006 value (MJ/m 3 ) volume 2005 volume Change Initial established reserves Cumulative production a Remaining established reserves downstream of field plants as is at standard gross heating value Minus liquids removed at straddle plants Remaining established reserves as is ( 38.3 tcf) b ( 38.4 tcf) b at standard gross heating value a May differ from actual annual production and also contains minor volumes of coalbed methane production. b tcf trillion cubic feet EUB ST : Alberta s Energy Reserves 2006 and Supply/Demand Outlook / Conventional Natural Gas 5-1


106 Annual reserves additions and production of natural gas since 1974 are depicted in Figure 5.1. It shows that total reserves additions have failed to keep pace with production, which has increased significantly since As illustrated in Figure 5.2, Alberta s remaining established reserves of marketable gas decreased by about 40 per cent since 1982, but has remained constant since EUB ST : Alberta s Energy Reserves 2006 and Supply/Demand Outlook / Conventional Natural Gas
107 5.1.2 Annual Change in Marketable Gas Reserves Figure 5.3 shows the breakdown of annual reserves additions into new, development, and reassessment from 1999 to Initial established reserves increased by m 3 from year-end This increase includes the addition of m 3 attributed to new pools booked in 2006, m 3 from development of existing pools, and a positive net reassessment of m 3. Reserves added through drilling alone totalled m 3, replacing 68 per cent of Alberta s 2006 production of m 3. These breakdowns are not available prior to Historical reserves growth and production data since 1966 are shown in Appendix B, Table B.8. During 2006, EUB staff carried out a number of projects to review pools that had not been re-evaluated for some time or appeared to have reserves under- or overbooked based on their reserve life index. The projects that resulted in large reserve changes are summarized below, and pools with major changes are listed in Table 5.2. Review of shallow gas pools within the Southeastern Alberta Gas System (MU) resulted in reserves reduction of m 3. This reduction is due to the re-evaluation of reserves by production decline and adjustment of recovery factors. Over the past six years, some m 3 of reserves were added to Southeastern Alberta Gas System due to continued drilling and development in the area. In 2006, a detailed review of pools within this area by production decline analysis shows that most of the larger and older pools are in decline, resulting in the downward adjustment of reserves. Some of the larger pools are listed in Table 5.2. About 425 producing pools that showed reserves-to-production ratios over 25 years were evaluated, and reserves were reduced for these pools by m 3. Some 1356 producing pools with reserves-to-production ratios of less than two years were evaluated and reserves were increased by m 3. Production decline analysis was used in estimating reserves for these pools. EUB ST : Alberta s Energy Reserves 2006 and Supply/Demand Outlook / Conventional Natural Gas 5-3

108 Other pools with significant changes that are listed in Table 5.2 are Blackstone Beaverhill Lake A Pool, with a decrease of m 3, the Provost Viking, Belly River MU#1 Pool, with a decreases of m 3, the Rainbow Bluesky A and Banff G Pool, with an increase of m 3, and the Wild River Cardium, Dunvegan, Fort St. John, and Bullhead MU#1 Pool, with an increase of m 3. The 36 pools listed in Table 5.2 account for reserve additions of m 3, or 18.2 per cent of all additions for Figure 5.4 illustrates a comparison in marketable gas reserves growth between 2006 and 2005 by modified PSAC areas. The most significant growth was in Area 2, which accounted for 66 per cent of the total annual change for Some pools within PSAC Area 2 that contributed to this increase in reserves are the Rundle A, B, C, Q, and R Pool, Limestone Wabamun A Pool, Ricinus Cardium A Pool, and Wild River Cardium, Dunvegan, Fort St. John, and Bullhead MU#1 Pool, for a total of m EUB ST : Alberta s Energy Reserves 2006 and Supply/Demand Outlook / Conventional Natural Gas
109 Table 5.2. Major natural gas reserve changes, 2006 Initial established reserves (10 6 m 3 ) Pool 2006 Change Main reasons for change Atlee-Buffalo Southeastern Alberta Gas System (MU) Re-evaluation of initial volume in place Bantry Southeastern Alberta Re-evaluation of initial volume in place Gas System (MU) Benjamin Rundle A, B, C,Q & R Re-evaluation of initial volume in place and recovery factor Bighorn Turner Valley C Re-evaluation of initial volume in place Blackstone Beaverhill Lake A Re-evaluation of initial volume in place Brazeau River Viking, Mannville & Jurassic Mu # Re-evaluation of initial volume in place Brazeau River Elkton-Shunda A Re-evaluation of initial volume in place Brown Creek Turner Valley A, B, C & D Re-evaluation of initial volume in place Cessford Southeastern Alberta Gas System (MU) Re-evaluation of initial volume in place Chickadee Upper Mannville A, D, E, F, G & Gething D Chime Second White Specks A and Dunvagen C & E Re-evaluation of initial volume in place Re-evaluation of initial volume in place Coleman Rundle A & Palliser B Re-evaluation of initial volume in place Enchant Basal Belly River B and Second White Specks B Gadsby Edmonton, Belly River and Mannville MU # Addition of new pool, development and re-evaluation of initial volume in place Re-evaluation of initial volume in place Hanna Second White Specks E Re-evaluation of initial volume in place Jumping Pound West Rundle A & B Re-evaluation of initial volume in place Knopcik Halfway N and Montney A Re-evaluation of initial volume in place Leland Cadotte A & C and Cadomin A Re-evaluation of initial volume in place and recovery factor Limestone Rundle A & B and Leduc C Re-evaluation of initial volume in place (continued) EUB ST : Alberta s Energy Reserves 2006 and Supply/Demand Outlook / Conventional Natural Gas 5-5
110 Table 5.2. Major natural gas reserve changes, 2006 (concluded) Initial established reserves (10 6 m 3 ) Pool 2006 Change Main reasons for change Limestone Wabamun A Re-evaluation of initial volume in place Limestone Nisku A and Leduc A Re-evaluation of initial volume in place and recovery factor Marsh Leduc A Re-evaluation of initial volume in place Medicine Hat Southeastern Alberta Gas System (MU) Medicine River Mannville and Jurassic MU# Re-evaluation of initial volume in place Re-evaluation of initial volume in place Nevis Edmonton and Belly River MU# Re-evaluation of initial volume in place and recovery factor Provost Viking, Belly River and Mannville MU# Re-evaluation of initial volume in place and recovery factor Rainbow Bluesky A and Banff G Addition of new pool and re-evaluation of initial volume in place Retlaw Basal Belly River I, K and Second White Specks B Re-evaluation of initial volume in place Ricinus Cardium A Re-evaluation of initial volume in place Stolberg Rundle A, B, C & D Addition of new pool and re-evaluation of initial volume in place Sundance Smokey, Dunvagen, Fort St. John & Bullhead MU#1 Verger Southeastern Alberta Gas System (MU) Westrose South Belly River, Mannville and Rundle MU#1 Wild River Cardium, Dunvagen, Fort St. John & Bullhead MU#1 Wintering Hills Southeastern Alberta Gas System (MU) Re-evaluation of initial volume in place Re-evaluation of initial volume in place and recovery factor Re-evaluation of initial volume in place Addition of new pools and re-evaluation of initial volume in place Re-evaluation of initial volume in place Wizard Lake D-3A Re-evaluation of initial volume in place 5-6 EUB ST : Alberta s Energy Reserves 2006 and Supply/Demand Outlook / Conventional Natural Gas
 m 3 or less, while representing 70.5 per cent of all pools, contain only 12 per cent of the province s remaining marketable reserves.")
111 5.1.3 Distribution of Natural Gas Reserves by Pool Size The distribution of marketable gas reserves by pool size is shown in Table 5.3. For the purposes of this table, commingled pools are considered as one pool and multifield pools are considered on a field basis. The data show that pools with reserves of 30 million (10 6 ) m 3 or less, while representing 70.5 per cent of all pools, contain only 12 per cent of the province s remaining marketable reserves. Similarly, the largest pools, while representing only 1 per cent of all pools, contain 48 per cent of the remaining reserves. Figure 5.5 shows by percentage and by size distribution the total number of pools, initial reserves, and remaining reserves, as listed in Table 5.3. Figure 5.6 depicts natural gas pool size by discovery year since 1965 and illustrates that the median pool size has remained fairly constant at about m 3 for many years, while the average size declined from about m 3 in 1965 to m 3 in 1987 and has since declined further to about m 3 in Table Distribution of natural gas reserves by pool size, 2006 Initial established Remaining established Reserve range Pools marketable reserves marketable reserves (10 6 m 3 ) # % 10 9 m 3 % 10 9 m 3 % Less than Total EUB ST : Alberta s Energy Reserves 2006 and Supply/Demand Outlook / Conventional Natural Gas 5-7


112 5.1.4 Geological Distribution of Reserves The distribution of reserves by geological period is shown graphically in Figure 5.7, and a detailed breakdown of gas in place and marketable gas reserves by formation is given in Appendix B, Table B.9. The Upper and Lower Cretaceous period accounts for some 70.5 per cent of the province s remaining established reserves of marketable gas and is important as a source of future natural gas. The geologic strata containing the largest remaining reserves are the Lower Cretaceous Mannville, with 26.1 per cent, the Upper Cretaceous Milk River and Medicine Hat, with 18.3 per cent, and the Mississippian Rundle, with 8.0 per cent. Together, these strata contain 52.4 per cent of the province s remaining established reserves. The percentages of remaining reserves in these geological strata have remained fairly constant over the last five years Reserves of Natural Gas Containing Hydrogen Sulphide Natural gas that contains greater than 0.01 per cent hydrogen sulphide (H 2 S) is referred to as sour in this report. As of December 31, 2006, sour gas accounts for some 21 per cent ( m 3 ) of the province s total remaining established reserves and about 33 per cent of natural gas marketed in This 33 per cent is similar to previous years. The average H 2 S concentration of initial producible reserves of sour gas in the province at year-end 2006 is 8.9 per cent. The distribution of reserves for sweet and sour gas (Table 5.4) shows that m 3, or about 74 per cent, of remaining sour gas reserves occurs in nonassociated pools. Figure 5.8 indicates that the proportion of remaining marketable reserves of sour to sweet gas since 1984 has remained fairly constant, between 20 and 25 per cent of the total. The distribution of sour gas reserves by H 2 S content is shown in Table 5.5 and indicates that m 3, or 22 per cent, of sour gas contains H 2 S concentrations greater than 10 per cent, while 47 per cent ( m 3 ) contains concentration of less than 2 per cent. 5-8 EUB ST : Alberta s Energy Reserves 2006 and Supply/Demand Outlook / Conventional Natural Gas
113 Table Distribution of sweet and sour gas reserves, 2006 Marketable gas (10 9 m 3 ) Initial Remaining established Cumulative established Type of gas reserves production reserves Initial established reserves Percentage Remaining established reserves Sweet Associated & solution Nonassociated Subtotal Sour Associated & solution Nonassociated Subtotal Total a (170) b (131) b (39.6) b a Reserves estimated at field plants. b Imperial equivalent in trillions of cubic feet at pounds per square inch absolute and 60 F. EUB ST : Alberta s Energy Reserves 2006 and Supply/Demand Outlook / Conventional Natural Gas 5-9
 Remaining established reserves (10 9 m 3 ) H2S content in Associated & Associated & raw gas solution")

114 Table 5.5. Distribution of sour gas reserves by H2S content, 2006 Initial established reserves (10 9 m 3 ) Remaining established reserves (10 9 m 3 ) H2S content in Associated & Associated & raw gas solution Nonassociated solution Nonassociated Total % Less than Over Total Percentage Reserves of Retrograde Condensate Pools Retrograde gas pools are pools rich in liquids that reinject dry gas to maintain reservoir pressure and maximize liquid recovery. Reserves of major retrograde condensate pools are tabulated on both energy content and a volumetric basis. The initial energy in place, recovery factor, and surface loss factor (both factors on an energy basis), as well as the initial marketable energy for each pool, are listed in Appendix B, Table B.10. The table also lists raw and marketable gas heating values used to convert from a volumetric to an energy basis. The volumetric reserves of these pools are included in the Gas Reserves and Basic Data table, which is on the companion CD to this report (see Appendix C) Reserves Accounting Methods The EUB, in its Gas Reserves Data file, books remaining marketable gas reserves on a pool-by-pool basis initially on volumetric determination of in-place resources and application of recovery efficiency and surface loss. Subsequent reassessment of reserves is made as new information becomes available using additional geological data, material 5-10 EUB ST : Alberta s Energy Reserves 2006 and Supply/Demand Outlook / Conventional Natural Gas

115 balance, and production decline analysis. Based on the gas analysis for each pool, a surface loss is estimated using an algorithm that reflects expected recovery of liquids at field plants, as shown in Figure 5.9. A minimum 5 per cent is added to account for loss due to lease fuel (4 per cent) and flaring. Therefore, marketable gas reserves of individual pools on the EUB s gas reserves database reflect expected recovery after processing at field plants. For about 80 per cent of Alberta s marketable gas (notable exceptions being Alliance Pipeline and some of the mostly dry Southeastern Alberta gas), additional liquids contained in the gas stream leaving the field plants are extracted downstream at straddle plants. As the removal of these liquids cannot be tracked back to individual pools, a gross adjustment for these liquids is made to arrive at the estimate for remaining reserves of marketable gas for the province. These reserves therefore represent the volume and average heating content of gas available for sale after removal of liquids from both field and straddle plants. It is expected that some m 3 of liquid-rich gas will be extracted at straddle plants, thereby reducing the remaining established reserves of marketable gas (estimated at the field plant gate) from m 3 to m 3 and the thermal energy content from 43.4 to 40.2 exajoules. Figure 5.9 also shows the average percentage of remaining established reserves of each hydrocarbon component expected to be extracted at field and straddle plants. For example, of the total ethane content in raw natural gas, about 25 per cent is expected to be removed at field plants and an additional 40 per cent at straddle plants. Therefore, the EUB estimates reserves of liquid ethane that will be extracted based on 65 per cent of the total raw ethane gas reserves. The remaining 35 per cent of the ethane is left in the marketable gas and sold for its heating value. This ethane represents a potential source for future ethane supply. Reserves of NGLs are discussed in more detail in Section 6. EUB ST : Alberta s Energy Reserves 2006 and Supply/Demand Outlook / Conventional Natural Gas 5-11

.")
116 5.1.8 Multifield Pools Pools that extend over more than one field are classified as multifield pools and are listed in Appendix B, Table B.11. Each multifield pool shows the individual remaining established reserves assigned to each field and the total remaining established reserves for the multifield pool Ultimate Potential In March 2005, the EUB and the National Energy Board (NEB) jointly released Report 2005-A: Alberta s Ultimate Potential for Conventional Natural Gas (EUB/NEB 2005 Report), an updated estimate of the ultimate potential for conventional natural gas. The Boards adopted the medium case representing an ultimate potential of m 3 (223 trillion cubic feet). This estimate does not include unconventional gas, such as CBM. Figure 5.10 shows the historical and forecast growth in initial established reserves of marketable gas. Historical growth to 2006 equals 4.9 trillion (10 12 ) m 3. Figure 5.11 plots production and remaining established reserves of marketable gas compared to the estimate of ultimate potential. Table 5.6 provides details on the ultimate potential of marketable gas, with all values shown both as is and converted to the equivalent standard heating value of 37.4 MJ/m 3. It shows that initial established marketable reserves of m 3, or 76.5 per cent of the ultimate potential of m 3, has been discovered as of year-end This leaves m 3, or 23.5 per cent, as yet-to-be-discovered reserves. Cumulative production of m 3 at year-end 2006 represents 58.6 per cent of the ultimate potential, leaving m 3, or 41 per cent, available for future use EUB ST : Alberta s Energy Reserves 2006 and Supply/Demand Outlook / Conventional Natural Gas

117 Table 5.6. Remaining ultimate potential of marketable gas, 2006 (10 9 m 3 ) Gross heating value As is (38.9 MJ/m MJ/m 3 Yet to be established Ultimate potential Minus initial established Remaining established Initial established Minus cumulative production Remaining ultimate potential Yet to be established Plus remaining established The regional distribution of initial established reserves, remaining established reserves, and yet-to-be-established reserves is shown by PSAC area in Figure It shows that the Western Plains (Area 2) contains about 38 per cent of both the remaining established reserves and the yet-to-be-established reserves. Although the majority of gas wells are being drilled in the Southern Plains (Areas 3, 4, and 5), Figure 5.12 shows that based on the EUB/NEB 2005 Report, Alberta natural gas supplies will continue to depend on significant new discoveries in the Western Plains. EUB ST : Alberta s Energy Reserves 2006 and Supply/Demand Outlook / Conventional Natural Gas 5-13


118 Figure 5.13 shows by geological period the discovered and ultimate potential gas in place for year-end 2005 (EUB/NEB 2005 Report). It illustrates that 57 per cent of the ultimate potential gas in place is in the Upper and Lower Cretaceous EUB ST : Alberta s Energy Reserves 2006 and Supply/Demand Outlook / Conventional Natural Gas
119 5.2 Supply of and Demand for Conventional Natural Gas In projecting natural gas production, the EUB considers three components: expected production from existing gas wells, expected production from new gas well connections, and gas production from oil wells. The EUB also takes into account its estimates of the remaining established and yet-to-be-established reserves of natural gas in the province. The EUB reviews the projected demand for Alberta natural gas annually. The focus of these reviews is on intra-alberta natural gas use, and a detailed analysis is undertaken of many factors, such as population growth, industrial activity, alternative energy sources, and environmental factors that influence natural gas consumption in the province Natural Gas Supply Alberta produced m 3 (standardized to 37.4 MJ/m 3 ) of marketable natural gas from its conventional gas and oil wells in 2006, similar to the previous year s volumes. As noted in Section 4, Alberta also produced m 3 of coalbed methane (CBM). The CBM volume includes some production of conventional gas, as the coals are often interbedded with conventional gas reservoirs. In 2006, total natural gas production increased to m 3, an increase of 1.3 per cent, compared to m 3 in Natural gas prices and their volatility, drilling activity, the location of Alberta s reserves, the production characteristics of today s wells, and market demand are the major factors affecting Alberta natural gas production. Market forces are driving record levels of drilling, and industry is challenged to replace production from existing wells. The high decline rate of production from existing wells and the lower initial productivities of new gas wells are having an impact on current production levels. The drilling focus in recent years has been heavily weighted towards the shallow gas plays of Southeastern Alberta. This region has seen an increasing number of natural gas wells over the last 10 years due to the lower risk, lower cost of drilling, and quick tie-in times. The conventional marketable natural gas production volumes for 2006 stated in Table 5.7 have been calculated based on Supply and Disposition of Marketable Gas in ST3: Alberta Energy Resource Industries Monthly Statistics. High demand for Alberta natural gas in recent years has led to a considerable increase in the level of drilling in the province. Producers are using strategies such as infill drilling to maximize production levels. The number of successful gas wells drilled in Alberta in the last two years is shown by geographical area (modified PSAC area) in Figure In 2006, some conventional natural gas wells were drilled in the province, a decrease of 9 per cent from 2005 levels. A large portion of gas drilling has taken place in Southeastern Alberta, representing 44 per cent of all conventional natural gas wells drilled in The commodity price declines that took place in late 2006 are responsible for a slowdown in gas drilling, which is expected to continue well into Natural gas produced in Alberta has an average heating value of about 38.9 MJ/m 3. EUB ST : Alberta s Energy Reserves 2006 and Supply/Demand Outlook / Conventional Natural Gas 5-15

120 Table 5.7. Marketable natural gas volumes (10 6 m 3 ) Marketable gas production 2006 Total gas production Minus CBM production Total conventional gas production Minus storage withdrawals Raw gas production Minus injection total Net raw gas production Minus processing shrinkage raw Minus flared raw Minus vented raw Minus fuel raw Plus storage injections Calculated marketable gas production at as-is conditions Calculated marketable gas MJ/m Drilling levels were down in all other areas of the province, with the exception of Area 1 (Foothills), Area 6 (Northeastern Alberta), and Area 7 (Northwestern Alberta). Note that the gas well drilling numbers represent wellbores that contain one or more geological occurrence capable of producing natural gas EUB ST : Alberta s Energy Reserves 2006 and Supply/Demand Outlook / Conventional Natural Gas


121 The number of successful natural gas wells drilled in Alberta from 1997 to 2006 is shown in Figure 5.15, along with the number of wells connected (placed on production) in each year. Both of these numbers are used as indicators of industry activity and future production. The definition of a gas well connection differs from that of a drilled well. While gas well drilling levels represent wellbores, well connections refer to geological (producing) occurrences within a well, and there may be more than one per well. The number of natural gas wells connected in a given year historically tends to follow natural gas well drilling activity, indicating that most natural gas wells are connected shortly after being drilled. However, in the period , a much larger number of natural gas wells were connected than drilled. Alberta had a large inventory of nonassociated gas wells that had been drilled in previous years and were left shut in. Many of these wells were placed on production during the 1990s. In 2006 the number of new wells connected was greater than the number of gas wells drilled. This was due to the time delay in bringing gas wells drilled in the previous year on production. As well, drilling activity levels fell in 2006 to levels last seen in The distribution of natural gas well connections and the initial operating day rates of the connected wells in the year 2006 are illustrated in Figures 5.16 and 5.17 respectively. EUB ST : Alberta s Energy Reserves 2006 and Supply/Demand Outlook / Conventional Natural Gas 5-17
122 5-18 EUB ST : Alberta s Energy Reserves 2006 and Supply/Demand Outlook / Conventional Natural Gas
, Area 2 (Western Plains), and Area 5 (Central Alberta) experienced increases in production in 2006.")


123 Figure 5.18 illustrates historical gas production from gas wells by geographical area. Area 1 (Foothills), Area 2 (Western Plains), and Area 5 (Central Alberta) experienced increases in production in Conventional marketable gas production in Alberta from 1990 to 2006 is shown in Figure 5.19, along with the number of gas wells on production in each year. The number of producing gas wells has increased significantly year over year, while gas production has stabilized after reaching its peak in By 2006, the total number of producing gas wells increased to , from wells in It now takes an increasing number of new gas wells each year to offset production declines in existing wells. Average gas well productivity has been declining over time. As shown in Figure 5.20, about 62 per cent of the operating gas wells produce less than 2 thousand (10 3 ) m 3 /d. In 2006, these gas wells operated at an average rate of m 3 /d per well and produced less than 12 per cent of the total gas production. Less than 1 per cent of the total gas wells produced at rates over m 3 /d but contributed 16 per cent of the total production. The historical raw gas production by connection year in Alberta is presented in Figure Generally, a surface loss factor of around 13 per cent can be applied to raw gas production to yield marketable gas production. The bottom band in Figure 5.21 represents gas production from oil wells. Each band above represents production from new gas well connections by year. The percentages on the right-hand side of the figure represent the share of that band s production to the total production from gas wells in For example, 12 per cent of gas production in 2006 came from wells connected in that year. The figure shows that in 2006, 55 per cent of gas production came from gas wells connected in the last five years. EUB ST : Alberta s Energy Reserves 2006 and Supply/Demand Outlook / Conventional Natural Gas 5-19

124 Decline rates in natural gas production from new gas well connections from 1995 to 2004 have been evaluated after the wells drilled in a given year completed a full year of production EUB ST : Alberta s Energy Reserves 2006 and Supply/Demand Outlook / Conventional Natural Gas


125 Figure 5.22 presents a comparison of raw natural gas production in Alberta to both Texas and Louisiana onshore over the past 40-year period. Both Texas and Louisiana show peak gas production in the late 1960s and early 1970s, while Alberta appears to be at that stage today. It is interesting to note that for both Texas and Louisiana, gas production declined somewhat steeply after reaching peak production. However, over time production rates have been maintained at significant levels. EUB ST : Alberta s Energy Reserves 2006 and Supply/Demand Outlook / Conventional Natural Gas 5-21


126 Table 5.8 shows decline rates for gas wells connected from 1995 to 2004 with respect to the first, second, third, and fourth year of decline. Wells connected from the mid-1990s forward exhibit steeper declines in production in the first three years compared to wells connected in the earlier years. However, by the fourth year of production the decline rates have not changed significantly over time. The decline rates tend to stabilize at about 18 per cent from the fourth year forward. Table 5.8. Production decline rates for new well connections (%) Year wells connected First-year decline Second-year decline Third-year decline Fourth-year decline New well connections today start producing at much lower rates than new wells placed on production in previous years. Figure 5.23 shows the average initial productivity (peak rate) of new wells by connection year for the province and for wells in Southeastern Alberta (Area 3). Average initial productivities for new wells excluding Southeastern Alberta are also shown in the figure. This chart shows the impact that the low-productivity wells in Southeastern Alberta have on the provincial average. Based on the projection of natural gas prices provided in Section 1.2 and current estimates of reserves, the EUB expects that the number of new gas well connections in the province will remain high, at wells per year in 2007 and then per year for each year to Drilling activity in the southeastern part of Alberta is expected to remain strong 5-22 EUB ST : Alberta s Energy Reserves 2006 and Supply/Demand Outlook / Conventional Natural Gas

127 throughout the forecast period. EUB spacing requirements have been amended to allow for reduced baseline well densities in areas east of the 5th Meridian and south of Township 53. New requirements allow for two gas wells per section in the Mannville Group and four gas wells per section in formations above the Mannville. Figure 5.24 illustrates historical and forecast new well connections and plant gate prices. In projecting natural gas production, the EUB considered three components: expected production from existing gas wells, expected production from new gas well connections, and gas production from oil wells. Based on observed performance, gas production from existing gas wells at year-end 2006 is assumed to decline by 18 per cent per year initially and move to 16 per cent by the second half of the forecast period. To project production from new gas well connections, the EUB considered the following assumptions: The average initial productivity of new natural gas wells in Southeastern Alberta will be m 3 /d in 2007 and will decrease to m 3 /d by The average initial productivity of new natural gas wells in the rest of the province will be m 3 /d in 2007 and will decrease to m 3 /d by Production from new wells will decline at a rate of 31 per cent the first year, 22 per cent the second year, 19 per cent the third year, and 18 per cent the fourth year and thereafter. Gas production from oil wells will decline by 2 per cent per year. Based on the remaining established and yet-to-be-established reserves and the assumptions described above, the EUB generated the forecast of natural gas production to 2016, as shown in Figure The production of natural gas from conventional reserves is expected to decrease from m 3 to m 3 by the end of the forecast period. If EUB ST : Alberta s Energy Reserves 2006 and Supply/Demand Outlook / Conventional Natural Gas 5-23

, natural gas from bitumen wells, and CBM. Figure 5.")
128 conventional natural gas production rates follow the projection, Alberta will have recovered 77 per cent of the m 3 ultimate potential by Gas production from sources other than conventional gas and oil wells includes processed gas from bitumen upgrading operations (including synthetic gas), natural gas from bitumen wells, and CBM. Figure 5.26 shows the production from the first two categories EUB ST : Alberta s Energy Reserves 2006 and Supply/Demand Outlook / Conventional Natural Gas
129 In 2006, some m 3 of process gas was generated at oil sands upgrading facilities and used as fuel. This number is expected to reach m 3 by the end of the forecast period. Natural gas production from bitumen wells and use in primary and thermal schemes was m 3 in 2006 and is forecast to increase to m 3 by This gas was used mainly as fuel to create steam for its in situ operations. Additional small volumes of gas are produced from primary bitumen wells and are used for local operations. Figure 5.27 shows the forecast of conventional natural gas production, along with gas production from other sources. While the production of conventional gas in Alberta is expected to decline over the forecast period by about 2.5 per cent per year, CBM production is expected to grow over time and offset a part of the decline Natural Gas Storage Commercial natural gas storage is used by the natural gas industry to provide short-term deliverability and is not used in the EUB s long-term production projection. Several pools in the province are being used for commercial natural gas storage to provide an efficient means of balancing supply with fluctuating market demand. Commercial natural gas storage is defined as the storage of third-party non-native gas; it allows marketers to take advantage of seasonal price differences, effect custody transfers, and maintain reliability of supply. Natural gas from many sources may be stored at these facilities under fee-forservice, buy-sell, or other contractual arrangements. In the summer season, when demand is lower, natural gas is injected into these pools. As winter approaches, the demand for natural gas supply rises, injection slows or ends, and production generally begins at high withdrawal rates. Figure 5.28 illustrates the natural gas injection into and withdrawal rates from the storage facilities in the province. EUB ST : Alberta s Energy Reserves 2006 and Supply/Demand Outlook / Conventional Natural Gas 5-25
130 Commercial natural gas storage pools, along with the operators and storage information, are listed in Table 5.9. Figure 5.29 presents the location of these facilities on the Alberta pipeline systems. EnCana Corporation ceased commercial storage operations at the Sinclair Gething D and Paddy C Pools as of May A new commercial gas storage scheme has been developed by TransCanada Pipelines Ltd. using the Edson Viking D pool. This depleted gas reservoir has working gas capacity of m 3. Table 5.9. Commercial natural gas storage pools as of December 31, 2006 Pool Operator Storage capacity (10 6 m 3 ) Maximum deliverability (10 3 m 3 /d) Injection volumes, 2006 (10 6 m 3 ) Carbon Glauconitic ATCO Midstream Niska Gas Storage Countess Bow Island N & Upper Mannville M5M Crossfield East Elkton A & D Edson Viking D Hussar Glauconitic R McLeod Cardium A McLeod Cardium D Sinclair Gething D & Paddy C Suffield Upper Mannville I & K, and Bow Island N & BB & GGG Withdrawal volumes, 2006 (10 6 m 3 ) CrossAlta Gas Storage TransCanada Pipelines Ltd Husky Oil Operations Limited PPM Corp Energy Canada Ltd. PPM Corp Energy Canada Ltd. EnCana Corporation Niska Gas Storage EUB ST : Alberta s Energy Reserves 2006 and Supply/Demand Outlook / Conventional Natural Gas
131 In 2006, natural gas injections for all storage schemes exceeded withdrawals by m 3. Marketable gas production volumes determined for 2006 were adjusted to account for the small imbalance in injection and withdrawal volumes to these storage pools. For the purpose of projecting future natural gas production, the EUB assumes that injections and withdrawals are balanced for each year during the forecast period. EUB ST : Alberta s Energy Reserves 2006 and Supply/Demand Outlook / Conventional Natural Gas 5-27


132 5.2.3 Alberta Natural Gas Demand The EUB reviews the projected demand for Alberta natural gas periodically. The focus of these reviews is on intra-alberta natural gas use, and a detailed analysis is undertaken of many factors, such as population, economic activity, and environmental issues that influence natural gas consumption in the province. Forecasting demand for Alberta natural gas in markets outside the province is done on a less rigorous basis. For Canadian ex- Alberta markets, historical demand growth and forecast supply are used in developing the demand forecasts. Export markets are forecast based on export pipeline capacity available to serve such markets and the recent historical trends in meeting that demand. Excess pipeline capacity to the United States. allows for gas to move to areas of the United States that provide for the highest netback to the producer. The major natural gas pipelines in Canada with removal points identified that move Alberta gas to market are illustrated in Figure Figure 5.31 illustrates the breakdown of marketable natural gas demand in Alberta by sector. By the end of forecast period, domestic demand will reach m 3, compared to m 3 in 2006, representing 44 per cent of total natural gas production. The Alberta Gas Resources Preservation Act (first proclaimed in 1949) provides supply security for consumers in Alberta by setting aside large volumes of gas for their use before gas removals from the province are permitted. The act requires that when a company proposes to remove gas from Alberta, it must apply to the EUB for a permit authorizing the removal. Exports of gas from Alberta are only permitted if the gas to be removed is surplus to the needs of Alberta s core consumers for the next 15 years. Core consumers are defined as Alberta residential, commercial, and institutional gas consumers who do not have alternative sustainable fuel sources EUB ST : Alberta s Energy Reserves 2006 and Supply/Demand Outlook / Conventional Natural Gas

 1. Total remaining established reserves a 1 136 Alberta Requirements 2. Core market requirements b 109 3. Contracted for non-core markets b 109 4.")
133 The calculation in Table 5.10 is performed on an annual basis to determine what volume of gas is available for exports after accounting for Alberta s future requirements. There is currently m 3 of surplus natural gas calculated using the 2006 remaining established reserves number. This represents a 7 per cent decrease in surplus over the year Figure 5.32 illustrates historical available for permitting volumes from 1997 to Table Estimate of gas reserves available for inclusion in permits as at December 31, m 3 at 37.4 MJ/m 3 Reserves (as at year-end 2006) 1. Total remaining established reserves a Alberta Requirements 2. Core market requirements b Contracted for non-core markets b Permit-related fuel and shrinkage 61 Permit Requirements 5. Remaining permit commitments c Total requirements 893 Available 7. Available for permits 243 a Previous estimates of gas available for permitting have included gas in the Beyond Economic Reach and Deferred categories that would become available over the next 20 years. However, in 1999 the EUB discontinued estimating reserves in these categories on the basis that the methods used did not result in accurate volumes and the effort did not add significant reserves to the total volume of reserves. b For these estimates, 15 years of core market requirements and 5 years of non-core requirements were used. c The remaining permit commitments are split approximately 37 per cent under short-term permits and 63 per cent under long-term permits. Residential gas requirements are expected to grow moderately over the forecast period, at an average annual rate of 2 per cent. The key variables that affect residential gas demand are natural gas prices, population, the number of households, energy efficiencies, and the weather. Energy efficiency improvements prevent energy use per household from rising EUB ST : Alberta s Energy Reserves 2006 and Supply/Demand Outlook / Conventional Natural Gas 5-29

134 significantly. Commercial gas demand in Alberta has fluctuated over the past 10 years and is expected to remain flat over the forecast period. This is largely due to gains in energy efficiencies and a shift to electricity. The significant increase in Alberta demand is due to increased development in the industrial sector. The purchased natural gas requirements for bitumen recovery and upgrading to synthetic crude oil, shown in Figure 5.33, are expected to increase annually from m 3 in 2006 to m 3 by Table 5.11 outlines the average purchased gas use rates for oil sands operations EUB ST : Alberta s Energy Reserves 2006 and Supply/Demand Outlook / Conventional Natural Gas
 (mcf/bbl) (m 3 /m 3")


135 Table oil sands average purchased gas use rates* Excluding purchased gas for electricity generation Including purchased gas for electricity generation Extraction Method (m 3 /m 3 ) (mcf/bbl) (m 3 /m 3 ) (mcf/bbl) In situ - SAGD CSS Mining Upgrading Mining with upgrading *Expressed as cubic metres of natural gas per cubic metre of bitumen/synthetic crude oil production. As noted earlier, oil sands upgrading operations produce process gas that is used on site. The in situ operations also produce solution gas from bitumen wells. Therefore, total gas demand in this sector is the sum of purchased gas, process gas, and solution gas produced at bitumen wells, as illustrated in Figure Gas use by the oil sands sector, including gas used by the electricity cogeneration units on site at the oil sands operations, is shown in Figure The potential high usage of natural gas in bitumen production and upgrading has exposed the companies involved in the business to the risk of volatile gas prices. The Opti Canada Inc./Nexen Inc. Long Lake Project will be employing technology that will produce synthetic gas by burning ashphaltines in its new bitumen upgrader expected to start up in late Other companies are now exploring the option of self-sufficiency for their gas requirements. The existing bitumen gasification technology is one attractive alternative EUB ST : Alberta s Energy Reserves 2006 and Supply/Demand Outlook / Conventional Natural Gas 5-31


136 being pursued. If implemented, natural gas requirements for this sector could decrease substantially. The electricity generating industry will also require increased volumes of natural gas to fuel some of the new plants expected to come on stream over the next few years. Natural gas requirements for electricity generation are expected to increase over the forecast period, from some m 3 in 2006 to m 3 by Electricity demand can be met from existing electricity plants and plants announced to be built over the forecast period. Figure 5.36 shows Alberta natural gas demand and production. Gas removals from the province represent the difference between natural gas production from conventional reserves and coal seams and Alberta demand. In 2006, some 28 per cent of Alberta production was used domestically. The remainder was sent to other Canadian provinces and the United States. By the end of forecast period, domestic demand represents 44 per cent of total natural gas production EUB ST : Alberta s Energy Reserves 2006 and Supply/Demand Outlook / Conventional Natural Gas

137 Gas production in Alberta may be higher than that forecast if commercial production of gas from the Mannville coal seams is accelerated. Mannville CBM production is largely at the pilot project stage to date, although companies have announced encouraging results. EUB ST : Alberta s Energy Reserves 2006 and Supply/Demand Outlook / Conventional Natural Gas 5-33
138
139 6 Natural Gas Liquids The EUB estimates remaining reserves of natural gas liquids (NGLs) based on volumes that are expected to be recovered from raw natural gas using existing technology and market conditions. The liquids reserves expected not to be removed from natural gas are included as part of the province s gas reserves discussed in Section 5.1. The EUB s projections on the overall recovery of each NGL component are explained in Section and shown graphically in Figure Reserves of Natural Gas Liquids Provincial Summary Estimates of the remaining established reserves of extractable NGLs in 2006 are summarized in Tables 6.1 and 6.2. Figure 6.1 shows remaining established reserves of extractable NGLs compared to 2006 production. Total remaining reserves of extractable NGLs have increased by 2.3 per cent since Fields that have contributed significantly to this increase are Cecilia, Countess, and Rainbow, which are listed in Appendix B, Tables B.12 and B.13. It should be noted that minor adjustments were made to 2005 cumulative net production values because of revisions to the production values for years 2000 to Table 6.1. Established reserves and production of extractable NGLs as of December 31, 2006 (10 6 m 3 liquid) Change Cumulative net production a Ethane Propane b Butanes b Pentanes plus b Total Remaining (expected to be extracted) Ethane Propane Butanes Pentanes plus Total a Production minus those volumes returned to the formation or injected to enhance the recovery of oil. b May differ slightly with actual production as reported in ST3: Oil and Gas Monthly Statistics Ethane As of December 31, 2006, the EUB estimates remaining established reserves of extractable ethane to be million cubic metres (10 6 m 3 ) in liquefied form. This estimate includes m 3 of recoverable reserves from the ethane component of solvent injected into pools under miscible flood to enhance oil recovery. In 2006, the ethane volume remaining in solvent floods represented about 4.1 per cent of the total ethane reserves, slightly lower than the previous year. At the end of 2006, only six pools were still actively injecting solvent, the largest being the Rainbow Keg River F and Judy Creek Beaverhill Lake A pools. EUB ST : Alberta s Energy Reserves 2006 and Supply/Demand Outlook / Natural Gas Liquids 6-1
140 Table 6.2. Reserves of NGLs as of December 31, 2006 (10 6 m 3 liquid) Ethane Propane Butanes Pentanes plus Total remaining raw reserves Liquids expected to remain in dry marketable gas Remaining established recoverable from Field plants Straddle plants Solvent floods Total Total As shown in Table 6.2, an additional m 3 (liquid) of ethane is estimated to remain in the marketable gas stream and available for potential recovery. Figure 6.2 shows the remaining established reserves of ethane declining from 1995 to 2003 and then levelling off over the last three years. During 2006, the extraction of specification ethane was m 3, compared to m 3 in For individual gas pools, the ethane content of gas in Alberta falls within the range of to 0.20 mole per mole (mol/mol). As shown in Appendix B, Table B.12, the volumeweighted average ethane content of all remaining raw gas was mol/mol. Also listed in this table are ethane volumes recoverable from fields containing the largest ethane reserves and from solvent floods. The six largest fields Caroline, Ferrier, Pembina, Wild River, Willesden Green, and Wapiti account for 16.7 per cent of total ethane reserves but only 8.5 per cent of remaining established marketable gas reserves. 6-2 EUB ST : Alberta s Energy Reserves 2006 and Supply/Demand Outlook / Natural Gas Liquids


141 6.1.3 Other Natural Gas Liquids As of December 31, 2006, the EUB estimates remaining extractable reserves of propane, butanes, and pentanes plus to be m 3, m 3, and m 3 respectively. The breakdown in the liquids reserves during the past year are shown in Table 6.2. Appendix B, Table B.13, lists propane, butanes, and pentanes plus reserves in fields containing the largest remaining liquids reserves. The nine largest fields Ansell, Brazeau River, Caroline, Ferrier, Kaybob South, Pembina, Rainbow, Wild River, and Willesden Green account for about 24.1 per cent of the total liquid reserves. The volumes recoverable at straddle plants are not included in the field totals but are shown separately at the end of the table. During 2006, propane and butanes recovery at crude oil refineries was m 3 and m 3 respectively, while accounting for 10.8 per cent of remaining established marketable gas reserves Ultimate Potential The remaining ultimate potential for liquid ethane is considered to be those reserves that could reasonably be recovered as liquid from the remaining ultimate potential of natural gas. Historically, only a fraction of the ethane that could be extracted had been recovered. However, the recovery has increased over time to 58 per cent. The EUB estimates that 70 per cent of the remaining ultimate potential of ethane gas will be extracted. Based on remaining ultimate potential for ethane gas of m 3, the EUB estimates remaining ultimate potential of liquid ethane to be m 3. The other 30 per cent, or m 3, of ethane gas is expected to be sold for its heating value as part of the marketable gas. For liquid propane, butanes, and pentanes plus together, the remaining ultimate potential reserves are m 3. This assumes that remaining ultimate potential as a percentage of initial ultimate potential is 41.3 percent, similar to that of marketable gas. EUB ST : Alberta s Energy Reserves 2006 and Supply/Demand Outlook / Natural Gas Liquids 6-3
142 6.2 Supply of and Demand for Natural Gas Liquids For the purpose of forecasting ethane and other NGLs, the richness and production volumes from established and future reserves of conventional natural gas have an impact on future production. For ethane, demand also plays a major role in future extraction. The NGL content from new gas reserves is assumed to be similar to existing reserves. In the future, ethane and other gas liquids extracted from oil sands off-gas will play a role in supplementing supplies from conventional gas production Supply of Ethane and Other Natural Gas Liquids Ethane and other NGLs are recovered mainly from the processing of natural gas. Gas processing plants in the field extract ethane, propane, butanes, and pentanes plus as products or recover an NGL mix from raw gas production. NGL mixes are sent from these field plants to fractionation plants for the recovery of individual NGL specification products. Straddle plants (on NOVA Gas Transmission Lines and ATCO systems) recover NGL products from gas processed in the field. To compensate for the liquids removed, lean makeup gas volumes are purchased by the straddle plants and added to the marketable gas stream leaving the plants. Although some pentanes plus is recovered as condensate at the field level, the majority of the supply is recovered from the processing of natural gas. The other source of NGL supply is from crude oil refineries, where small volumes of propane and butanes are recovered. Figure 6.3 illustrates the stages involved in processing raw gas and crude oil for the recovery of ethane, propane, butanes, and pentanes plus. Ethane and other NGL production volumes are a function of raw gas production, liquid content, gas plant recovery efficiencies, and prices. High gas prices relative to NGL prices may cause gas processors to reduce liquid recovery. In 2006, ethane volumes extracted at Alberta processing facilities increased to m 3 /d from 2005 levels of m 3 /d. About 58 per cent of total ethane in the gas stream was extracted, while the remainder was left in the gas stream and sold for its heating value. Table 6.3 shows the volumes of specification ethane extracted at the three types of processing facilities during Table 6.3. Ethane extraction volumes at gas plants in Alberta, 2006 Gas plants Volume (10 6 m 3 ) Percentage of total Field plants Fractionation plants Straddle plants Total Table 6.4 lists the volumes of ethane, propane, butanes, and pentanes plus recovered from natural gas processing in Ratios of the liquid production in m 3 to 10 6 m 3 marketable gas production are shown as well. Propane and butanes volumes recovered at crude oil refineries were m 3 /d and m 3 /d respectively. 6-4 EUB ST : Alberta s Energy Reserves 2006 and Supply/Demand Outlook / Natural Gas Liquids

143 EUB ST : Alberta s Energy Reserves 2006 and Supply/Demand Outlook / Natural Gas Liquids 6-5
144 Table 6.4. Liquid production at ethane extraction plants in Alberta, 2006 and Gas Liquid Yearly production (10 6 m 3 ) Daily production (10 3 m 3 /d) Liquid/ gas ratio (m 3 /10 6 m 3 ) Yearly production (10 6 m 3 ) Daily production (10 3 m 3 /d) Liquid/ gas ratio (m 3 /10 6 m 3 ) Ethane Propane Butanes Pentanes plus As conventional gas production declines, less ethane will be available for use by the petrochemical sector. In response to the forecast decline in economically recoverable ethane, the provincial government announced a new policy to encourage the development of new supplies of cost-competitive ethane. The Incremental Ethane Extraction Policy (IEEP), announced in late September 2006, will provide incentives for petrochemical producers that use ethane as feedstock in order to sustain or expand Alberta s existing industry. These incentives are designed to allow for a significant reinvestment in the current ethane supply infrastructure and provide potential petrochemical growth opportunities. The policy focuses on supporting increased ethane extraction through the provision of consumption credits. The credits that are available to both conventional natural gas and oil sands projects would apply only to ethane used by producers over their current consumption, up to a maximum of $35 million per year in royalties collected. More details on the policy will be released later this year. Since the new policy announcement, several projects have come forward, as follows: NOVA Chemicals Corp. (NOVA) and Aux Sable Canada (Aux Sable) have recently announced plans to build a new ethane extraction facility near Edmonton that will provide NOVA with 6350 m 3 /d of ethane feedstock. Natural gas carrying the ethane will be supplied from the Alliance pipeline, which runs from northeast British Columbia to Chicago. It is expected to be in service by mid-2010, and the ethane will be moved via pipeline to NOVA s Joffre site. Inter Pipeline Fund has planned investments to increase ethane production at its Empress straddle plant in southern Alberta. Upon completion, facility enhancements will allow the extraction of 1106 m 3 /d of additional ethane. Initial production of incremental ethane is anticipated in the second quarter of Also announced is a proposed project to increase ethane recovery capacity at the Cochrane straddle plant operated by Inter Pipeline Extraction. The application is for increased ethane recovery of 2433 m 3 /d from the current design capacity of m 3 /d. The ethane recovery project is expected to be operational by the fourth quarter Off-gas from bitumen upgraders has the potential to bring on a large, long-term, and stable source of ethane feedstock. Off-gas is a mixture of hydrogen and light gases, including ethane, ethylene, and other light hydrocarbons. The majority of the off-gas produced from oil sands upgraders is presently being used as fuel for oil sands operations. Currently some natural gas liquids (C3+) are being extracted from Suncor s process gas volumes and sent for fractionation into specification products at Redwater, Alberta. Aux Sable has recently announced plans to build the first phase of a plant to process off-gas from the BA Energy upgrader located north of Fort Saskatchewan. The plant located next to the BA Energy site will start up in mid- to late 2008, to coincide with the start-up of the 6-6 EUB ST : Alberta s Energy Reserves 2006 and Supply/Demand Outlook / Natural Gas Liquids
145 upgrader. The plant will recover natural gas liquids, including an ethane/ethylene stream that will be sold to the petrochemical industry. It is expected that recovered ethane volumes will remain at 2006 levels of m 3 /d in 2007 and In 2009, ethane production will further increase to m 3 /d and hold there for the remainder of the forecast period, as shown in Figure 6.4. The figure also refers to ethane supply as potential, as it indicates the volumes of ethane that could be recovered from Alberta natural gas. The supply volumes are calculated based on the volume-weighted ethane content of conventional gas production in Alberta of 0.05 mol/mol and assume that 80 per cent of ethane could be recovered at processing facilities. Current processing plant capacity for ethane is some m 3 /d and is not a restraint to recovering the volumes forecast. Based on the historical ethane content of marketable gas in Alberta, adequate volumes of ethane are available to meet the forecast demand. Over the forecast period, the ratios of propane, butanes, and pentanes plus in m 3 (liquid) to 10 6 m 3 marketable gas are expected to remain constant, as shown in Table 6.4. Figures 6.4 to 6.7 show forecast production volumes to 2016 for ethane, propane, butanes, and pentanes plus respectively. As conventional gas production declines, so too will the natural gas liquid volumes. No attempt has been made to include ethane and other NGL production from the solvent flood banks injected into pools throughout the province to enhance oil recovery Demand for Ethane and Other Natural Gas Liquids Of the ethane extracted in 2006, about 93 per cent was used in Alberta as feedstock. Some 4 per cent was removed from the province under export permits. The remaining volume is an inventory/reporting adjustment. The petrochemical industry in Alberta is the major consumer of ethane recovered from natural gas in the province, with four plants using ethane as feedstock for the production of ethylene. The industry adds value to natural gas liquids by upgrading them to be used in the manufacture of products such as plastic, rope, and building materials. The petrochemical industry in North America has been challenged in the last few years by high and volatile energy prices. Since ethane prices follow natural gas prices, feedstock costs fluctuate throughout the years. Nonetheless, the Alberta ethylene industry has maintained its historical cost advantage for ethylene production compared to a typical ethane/propane cracker in the U.S. Gulf Coast. With global economics strengthening, demand for petrochemical products is growing rapidly. Even with robust industry prospects for new growth opportunities, global capacity growth is likely to lag behind demand. As shown in Figure 6.4, Alberta demand for ethane is projected to be m 3 /d for 2007 and In 2009, ethane demand will increase to m 3 /d and remain at this level over the forecast period, with all four ethylene plants running at 90 per cent of capacity. Small volumes of propane are currently being used to supplement ethane supplies at petrochemical facilities, and this is expected to continue through the forecast period. For purposes of this forecast, it was assumed that no new ethylene plants requiring Alberta ethane as feedstock will be built during the forecast period. To acquire ethane, the petrochemical industry pays a fee to NGL processing facility owners to extract and deliver ethane from natural gas streams processed at their facilities. In the second half of 2005, construction of the new Joffre feedstock pipeline was completed. It allows for a range of feedstocks to be transported from Fort Saskatchewan to Joffre. These feedstocks supplement the ethane supplies now used at the petrochemical plants at Joffre, EUB ST : Alberta s Energy Reserves 2006 and Supply/Demand Outlook / Natural Gas Liquids 6-7


146 where three of the four ethylene plants are located. The fourth is located in Fort Saskatchewan. Figure 6.5 shows Alberta demand for propane compared to the total available supply from gas processing plants. The difference between Alberta requirements and total supply represents volumes used by ex-alberta markets. Propane is used primarily as a fuel in remote areas for space and water heating, as an alternative fuel in motor vehicles, and for barbecues and grain drying. Small volumes of propane are currently being used to supplement ethane supplies at petrochemical facilities, and this is expected to continue throughout the forecast period. Figure 6.6 shows Alberta demand for butanes compared to the total available supply from gas processing plants. The difference between Alberta requirements and total supply represents volumes used by ex-alberta markets. Alberta demand for butanes will increase as refinery requirements grow. Butanes are used in gasoline blends as an octane enhancer. The other petrochemical consumer of butanes in Alberta is a plant that uses butanes to produce vinyl acetate. Figure 6.7 shows Alberta demand for pentanes plus compared to the total available supply. The largest use of Alberta pentanes plus is for diluent in the blending of heavy crude oil and bitumen to facilitate the transportation to market by pipeline. Diluent increases the API gravity and reduces the viscosity of heavy crude oil and bitumen. Typically, heavy crude oil requires 5.5 per cent of diluent to be added for Bow River and 17 per cent for Lloydminster heavy crudes respectively. The required diluent for bitumen varies from a low of 17 per cent to as high as 31.6 per cent, depending on the producing regions of the province. Over the forecast period, pentanes plus demand as diluent is expected to increase from m 3 /d to m 3 /d. This increased demand is largely in response to an anticipated 6-8 EUB ST : Alberta s Energy Reserves 2006 and Supply/Demand Outlook / Natural Gas Liquids


147 m 3 /d increase in diluent required for bitumen transport, rising to m 3 /d in 2016 from m 3 /d in Conversely, the diluent requirement for transport of heavy crude is expected to decline from m 3 /d in 2006 to m 3 /d by the end of the forecast period, due to declining crude oil production. However, despite the reduced heavy crude diluent requirement, shortages of Alberta pentanes plus as diluent are forecast to occur in Industry has been preparing for the tight supply of available diluent from Alberta by using and assessing alternative sources and types of diluent and/or by seeking to reduce the demand. EUB ST : Alberta s Energy Reserves 2006 and Supply/Demand Outlook / Natural Gas Liquids 6-9


148 EnCana Corporation imports up to m 3 /d of offshore condensate to help transport its growing oil sands production to U.S. markets. With access to the Kitimat, B.C., terminal facility, EnCana imports diluent and transports it by rail to an Alberta pipeline connection that feeds its oil sands operation. Enbridge Inc. has announced plans to proceed with the Southern Lights Pipeline, which will transport diluent from Chicago to Edmonton through a m 3 /d, 20 inch diameter pipeline. The pipeline is expected to be in service by mid Pembina Pipeline Corporation is proposing a pipeline system designed to transport m 3 /d of condensate from Kitimat to Edmonton. Enbridge has shipper support for a proposed condensate pipeline capable of initially transporting m 3 /d from Kitimat to Edmonton. The Gateway Condensate Import Pipeline is expected to be in service sometime between 2012 and Small volumes of pentanes plus from the United States are being brought into the province by rail for use as diluent. Several new bitumen upgraders, similar to OPTI/Nexen s Long Lake project, will be located in the field or in the Edmonton area, where they will upgrade in situ bitumen to synthetic crude oil. These projects will reduce Alberta s requirements for pentanes plus as diluent. The use of light crude oil, synthetic crude oil, or naphtha as diluent is an attractive alternative for moving in situ bitumen from the field to upgrading facilities EUB ST : Alberta s Energy Reserves 2006 and Supply/Demand Outlook / Natural Gas Liquids
149 7 Sulphur 7.1 Reserves of Sulphur Provincial Summary The EUB estimates the remaining established reserves of elemental sulphur in the province as of December 31, 2006, to be million tonnes (10 6 t), an increase of 78 per cent since This increase is due to an increase in reserves of bitumen under active development with the addition of Shell Jackpine, CNRL Horizon, and Petro- Canada/UTS Energy/Tech Cominco Fort Hills projects to the existing Suncor, Syncrude, and Albian Sands operations. The changes in sulphur reserves during the past year are shown in Table 7.1. Table 7.1. Reserves of sulphur as of December 31, 2006 (10 6 t) Change Initial established reserves from Natural gas Crude bitumen a Total Cumulative net production from Natural gas Crude bitumen b Total Remaining established reserves from Natural gas Crude bitumen a Total a Reserves of elemental sulphur from bitumen under active development as of December 31, Reserves from the entire surface mineable area are larger. b Production from surface mineable area only Sulphur from Natural Gas The EUB recognizes t of remaining established sulphur from natural gas reserves in sour gas pools at year-end 2006, a decrease of 12 per cent from This decrease was due mainly to downward revisions of gas reserves in the Caroline Crossfield and Crossfield East fields. Remaining established sulphur reserves has been calculated using a provincial recovery factor of 97 per cent, which was determined taking into account plant efficiency, acid gas flaring at plants, acid gas injection, and flaring of solution gas. The EUB estimates the ultimate potential for sulphur from natural gas to be t, with an additional t from ultra-high hydrogen sulphide (H 2 S) pools. Based on the initial established reserves of t, this leaves t yet to be established reserves from future discoveries of conventional gas. The EUB s sulphur reserves estimates from natural gas are shown in Table 7.2. Fields containing the largest recoverable sulphur reserves are listed individually and those containing less are grouped under All other fields. Fields with significant volumes of sulphur reserves in 2006 are Caroline, Crossfield East, Okotoks, and Waterton, which together accounted for t (36.6 per cent) of remaining established reserves from natural gas. EUB ST : Alberta s Energy Reserves 2006 and Supply/Demand Outlook / Sulphur 7-1
150 Table 7.2. Remaining established reserves of sulphur from natural gas as of December 31, 2006 Remaining established Remaining reserves of H2S reserves of sulphur Field marketable gas (10 6 m 3 ) content a (%) Gas (10 6 m 3 ) Solid (10 3 t) Benjamin Bighorn Blackstone Brazeau River Burnt Timber Caroline Cecilia Coleman Crossfield Crossfield East Elmworth Garrington Hanlan Jumping Pound West Kaybob South La Glace Lambert Limestone Marsh Moose Okotoks Pembina Pine Creek Quirk Creek Rainbow Rainbow South Ricinus West Waterton Wildcat Hills Windfall Subtotal All other fields Total a Volume-weighted average. 7-2 EUB ST : Alberta s Energy Reserves 2006 and Supply/Demand Outlook / Sulphur
151 7.1.3 Sulphur from Crude Bitumen Crude bitumen in oil sands deposits contains significant amounts of sulphur. As a result of current upgrading operations in which bitumen is converted to synthetic crude oil (SCO), an average of 90 per cent of the sulphur contained in the crude bitumen is either recovered in the form of elemental sulphur or remains in products including coke. It is currently estimated that some t of elemental sulphur will be recoverable from the m 3 of remaining established crude bitumen reserves in the surface-mineable area. These sulphur reserves were estimated by multiplying the remaining established reserves of crude bitumen by a factor of 40.5 t/1000 m 3 of crude bitumen. This ratio was revised from previous estimates to reflect both current operations and the expected use of high-conversion hydrogen-addition upgrading technology for the future development of surface-mineable crude bitumen reserves. Hydrogen-addition technology yields a higher elemental sulphur production than does an alternative carbon-rejection technology, since a larger percentage of the sulphur in the bitumen remains in upgrading residues, as opposed to being converted to H 2 S. If less of the mineable crude bitumen reserves is upgraded with the hydrogen-addition technology than currently estimated or if less of the mineable reserves is upgraded in Alberta, as has been announced, then the total sulphur reserves will be less. However, if some of the in situ crude bitumen reserves are upgraded in Alberta, as is currently planned, the sulphur reserves will be higher. The EUB is reviewing these future development scenarios and will report the changes in a future edition of this report Sulphur from Crude Bitumen Reserves under Active Development Only a portion of the surface-mineable established crude bitumen reserves is under active development at the Suncor, Syncrude, Albian Sands, Shell Jackpine, CNRL Horizon, and Petro-Canada/UTS Energy/Tech Cominco Fort Hills projects. The EUB has estimated the initial established sulphur reserves from these active projects to be t, or 69 per cent of estimated recoverable sulphur from the remaining established crude bitumen in the total surface-mineable area. A total of t of elemental sulphur has been produced from these projects, leaving remaining established reserves of t. During 2006, t of elemental sulphur was produced from the six active projects. 7.2 Supply of and Demand for Sulphur Sulphur Supply There are three sources of sulphur production in Alberta: processing of sour natural gas, upgrading of bitumen to SCO, and refining of crude oil into refined petroleum products. In 2006, Alberta produced t of sulphur, of which t was derived from sour gas, t from upgrading of bitumen to SCO, and just 11 thousand (10 3 ) t from oil refining. Sulphur production from these sources is depicted in Figure 7.1. While sulphur production from sour gas is expected to decrease from t in 2006 to t, or some 20 per cent, sulphur recovery in the bitumen upgrading industry is expected to increase to t from t by the end of the forecast period. Figure 7.2 shows sulphur production from gas processing plants from 1966 forward. Sulphur production volumes are a function of raw gas production, sulphur content, and gas plant recovery efficiencies. As conventional gas declines, less sulphur will be recovered from gas EUB ST : Alberta s Energy Reserves 2006 and Supply/Demand Outlook / Sulphur 7-3


152 processing plants. Sulphur production from the three existing oil sands upgrader operations is shown in Figure 7.3 for the period The Alberta refineries are expected to replace conventional crude and synthetic crude with bitumen, as integration of bitumen upgrading and refining takes place in this forecast period. With this integration, the sulphur recovery will increase from t in 2006 to t by Total sulphur production is expected to reach t by the end of forecast period. 7-4 EUB ST : Alberta s Energy Reserves 2006 and Supply/Demand Outlook / Sulphur

153 7.2.2 Sulphur Demand Demand for sulphur within the province in 2006 was about t, similar to that in It was used in production of phosphate fertilizer and kraft pulp and in other chemical operations. Some 97 per cent of the sulphur marketed by Alberta producers was shipped outside the province, primarily to United States and China. In the early 1990s, a number of traditionally sulphur-importing countries installed sulphurrecovery equipment in oil refineries and other sulphur-emitting facilities, largely for environmental reasons. Consequently, many of these countries became self-sufficient in sulphur and the price declined significantly. Under such low price conditions, many of Alberta s competitors ceased production of sulphur, enabling Alberta s market share to rise throughout the late 1990s. China s imports of sulphur have soared since 1995 and imports from Canada have increased substantially. China is now the world s largest importer of sulphur, which is used there primarily for making sulphuric acid to produce phosphate fertilizers. Figure 7.4 shows the export volumes sent to markets outside of North America in the last four years. Clearly, China accounts for the majority of Canadian exports to foreign countries. Increased global demand for sulphur resulted in a major price change, from US$16/t in 2001 to US$50/t in 2006 (FOB Vancouver). Because elemental sulphur (in contrast to sulphuric acid) is fairly easy to store, imbalances between production and disposition have traditionally been accommodated through net additions to or removals from sulphur stockpiles. If demand exceeds supply, sulphur is withdrawn from stockpiles; if supply exceeds demand, sulphur is added to stockpiles. EUB ST : Alberta s Energy Reserves 2006 and Supply/Demand Outlook / Sulphur 7-5


154 In the past few years, supply and demand have been in balance and are forecast to remain so until Sulphur stockpiles thereafter are expected to grow. Changes to the sulphur inventory are illustrated in Figure 7.5 as the difference between total supply and total demand. 7-6 EUB ST : Alberta s Energy Reserves 2006 and Supply/Demand Outlook / Sulphur
155 8 Coal Production of coal is from mines and is called raw coal. Some coal, particularly coal from the mountain and foothills regions of Alberta, needs to be processed prior to marketing; this processed coal is called clean coal. Clean coal (normally sold internationally) and raw coal from the plains region (normally sold within Alberta) are termed marketable coal. Reserves within this report refer to raw coal unless otherwise noted. The following information summarizes and marginally updates the material found in EUB Statistical Series : Reserves of Coal. Those seeking more detailed information or a greater understanding of the parameters and procedures used to calculate established coal reserves are referred to that report. 8.1 Reserves of Coal Provincial Summary The EUB estimates the remaining established reserves of all types of coal in Alberta at December 31, 2006, to be 33.5 gigatonnes (Gt). Of this amount, 22.7 Gt (or about 68 per cent) is considered recoverable by underground mining methods, 10.8 Gt is recoverable by surface mining methods, and 1.16 Gt is within permit boundaries of mines active in Table 8.1 gives a summary by rank of resources and reserves from 244 coal deposits. Table 8.1. Established initial in-place resources and remaining reserves of raw coal in Alberta as of December 31, 2006 a (Gt) Initial Rank in-place Initial Cumulative Remaining Classification resources reserves production reserves Low- and mediumvolatile bituminous b Surface Underground Subtotal 6.83 c 1.56 c d c High-volatile bituminous Surface Underground Subtotal 5.90 c 2.88 c d c Subbituminous e Surface Underground Subtotal 80.7 c 30.3 c c Total c 93.7 c 34.8 c c a Tonnages have been rounded to three significant figures. b Includes minor amounts of semi-anthracite. c Totals for resources and reserves are not arithmetic sums but are the result of separate determinations. d Difference due to rounding. e Includes minor lignite. EUB ST : Alberta s Reserves 2006 and Supply/Demand Outlook / Coal 8-1
156 Minor changes in remaining established reserves from December 31, 2005, to December 31, 2006, resulted from increases in cumulative production. During 2006, the low- and medium-volatile, high-volatile, and subbituminous production tonnages were Gt, Gt, and Gt respectively Initial in-place Resources Several techniques, in particular the block kriging, grid, polygon, and cross-section methods, have been used for calculating in-place volumes, with separate volumes calculated for surface- and underground-mineable coal. In general, shallow coal is mined more cheaply by surface than by underground methods; such coal is therefore classified as surface-mineable. At some stage of increasing depth and strip ratio, the advantage passes to underground mining; this coal is considered underground-mineable. The classification scheme used to differentiate between surfaceand underground-mineable coal is very broadly based on depth and strip ratio, designed to reflect relative costs, but it does not necessarily mean that the coal could be mined under the economic conditions prevailing today Established Reserves Certain parts of deposits are considered nonrecoverable for technical, environmental, or safety reasons and therefore have no recoverable reserves. For the remaining areas, recovery factors have been determined for the surface-mineable coal, as well as the thicker underground classes. A recovery factor of 90 per cent has been assigned to the remaining in-place surfacemineable area, followed by an additional small coal loss at the top and a small dilution at the bottom of each seam. In the case of underground-mineable coal, geologically complex environments may make mining significant parts of some deposits uneconomic. Because there is seldom sufficient information to outline such areas, it is assumed that in addition to the coal previously excluded, only a percentage of the remaining deposit areas would be mined. Thus a deposit factor has been allowed for where, on average, only 50 per cent of the remaining deposit area is considered to be mineable in the mountain region, 70 per cent in the foothills, and 90 per cent in the plains (the three regions designated by the EUB within Alberta where coals of similar quality and mineability are recovered). A mining recovery factor of 75 per cent is then applied to both medium (1.5 to 3.6 metres [m]) and thick (> 3.6 m) seams, with a maximum recoverable thickness of 3.6 m applied to thick seams. Thin seams (0.6 to <1.5 m) are not currently considered recoverable by underground methods. Any developer wishing to mine coal in Alberta must first obtain a permit and licence from the EUB. An application for a permit must include extensive information on such matters as coal reserves, proposed mining methods, and marketing of coal. Coal reserves within the applied-for mine area must be at least sufficient to meet the marketing plans of the applicant. Table 8.2 shows the established resources and reserves within the current permit boundaries of those mines active (either producing or under construction) in EUB ST : Alberta s Reserves 2006 and Supply/Demand Outlook / Coal
157 Table 8.2. Established resources and reserves of raw coal under active development as of December 31, 2006 Initial in-place Initial Cumulative Remaining Rank Permit area resources reserves production reserves c Mine (ha) (Mt) a (Mt) (Mt) (Mt) Low- and mediumvolatile bituminous Cheviot Grande Cache Subtotal High-volatile bituminous Coal Valley Subtotal Subbituminous Vesta Paintearth Sheerness Dodds Burtonsville Island b Whitewood Highvale Genesee Subtotal c Total a Mt = megatonnes; mega = b Formerly known as Keephills mine. c Differences are due to rounding Ultimate Potential A combination of two methods has been used to estimate ultimate potentials. The first, the volume method, gives a broad estimate of area, coal thickness, and recovery ratio for each coal-bearing horizon, while the second method estimates the ultimate potential from the trend of initial reserves versus exploration effort. A large degree of uncertainty is inevitably associated with estimation of an ultimate potential. New data could substantially alter results derived from the current best fit. To avoid large fluctuations of ultimate potentials from year to year, the EUB has adopted the policy of using the figures published in Statistical Series : Reserves of Coal and adjusting them slightly to reflect the most recent trends. Table 8.3 gives quantities by rank for surface- and underground-mineable ultimate in-place resources, as well as the ultimate potentials. No change to ultimate potential has been made for EUB ST : Alberta s Reserves 2006 and Supply/Demand Outlook / Coal 8-3


158 Table 8.3. Ultimate in-place resources and ultimate potentials a (Gt) Coal rank Ultimate Ultimate Classification in-place potential Low- and mediumvolatile bituminous Surface Underground Subtotal High-volatile bituminous Surface Underground Subtotal Subbituminous Surface Underground Subtotal Total b 620 a Tonnages have been rounded to two significant figures, and totals are not arithmetic sums but are the result of separate determinations. b Work done by the Alberta Geological Survey suggests that the value is likely significantly larger. 8.2 Supply of and Demand for Marketable Coal Alberta s coal production dates back to the 1800s, when coal was used mainly for domestic heating and cooking. Historical coal production by type is illustrated in Figure EUB ST : Alberta s Reserves 2006 and Supply/Demand Outlook / Coal


159 Alberta produces three types of marketable coal: subbituminous, metallurgical bituminous, and thermal bituminous. Subbituminous coal is mainly used for electricity generation in Alberta. Metallurgical bituminous coal is exported and used for industrial applications, such as steel making. Thermal bituminous coal is also exported and used to fuel electricity generators in distant markets. The higher calorific content of bituminous thermal coal makes it possible to economically transport the coal over long distances. While subbituminous coal is burned without any form of upgrading, both types of export coal are sent in raw form to a preparation plant, whose output is referred to as clean coal. Subbituminous raw coal and clean bituminous coal are collectively known as marketable coal Coal Supply The location of coal mine sites in Alberta is shown in Figure 8.2. In 2006, eleven mine sites supplied coal in Alberta, as shown in Table 8.4. Excluded from this is the Obed mine, which was suspended in The operating mines produced 32.5 megatonnes (Mt) of marketable coal. Subbituminous coal accounted for 80.3 per cent of the total, bituminous metallurgical 8.6 per cent, and bituminous thermal coal the remaining 11.1 per cent. Continuing high crude oil prices have resulted in improved economics in the coal markets; hence, thermal coal production capacity at the Coal Valley mine more than doubled in EUB ST : Alberta s Reserves 2006 and Supply/Demand Outlook / Coal 8-5
160 Table 8.4. Alberta coal mines and marketable coal production in 2006 Operator/owner Production (grouped by coal type) Mine Location (Mt) Subbituminous coal Luscar Ltd. / EPCOR Generation Genesee Genesee 6.6 Luscar Ltd. Sheerness Sheerness 3.6 Paintearth Halkirk 1.5 Vesta Cordel 1.5 Luscar Ltd./TransAlta Utilities Corp. Highvale Wabamun 12.5 Whitewood Wabamun 1.3 Dodds Coal Mining Co. Ltd. Dodds Ryley Keephills Aggregate Ltd. Burtonsville Island Burtonsville Island Bituminous metallurgical coal Cardinal River Coals Ltd./Elk Valley Cheviot Mountain Park 1.7 Grande Cache Grande Cache Grande Cache 1.1 Bituminous thermal coal Luscar Ltd. Coal Valley Coal Valley 3.6 Total 32.5 Six large mines and two small mines produce subbituminous coal. The large mines serve nearby electric power plants, while the small mines supply residential and commercial customers. Because of the need for long-term supply to power plants, most of the reserves have been dedicated to the power plants. Two surface mines and one underground mine produce the provincial metallurgical grade coal. Although metallurgical grade coal underlies much of the mountain region, few areas have sufficient economical recoverable reserves at current prices. Forecast Alberta production for each of the three types of marketable coal is shown in Figure EUB ST : Alberta s Reserves 2006 and Supply/Demand Outlook / Coal
 is planned to be in service in 2011, with the potential for an additional plant fuelled by subbituminous")

161 8.2.2 Coal Demand In Alberta, the subbituminous mines primarily serve coal-fired electric generation plants, and their production ties in with electricity generation. One power generation unit at the Keephills plant site with a capacity of 450 megawatts (MW) is planned to be in service in 2011, with the potential for an additional plant fuelled by subbituminous coal within the forecast period. Alberta s metallurgical coal primarily serves the Asian steel industry, mainly Japan, but export coal producers have the competitive disadvantage of long distances from mine to port. Currently export markets are expected to remain relatively strong over the next few years due to the high natural gas/crude oil prices, high levels of steel consumption, and a continuing strong demand in the Pacific Rim countries. EUB ST : Alberta s Reserves 2006 and Supply/Demand Outlook / Coal 8-7
162
163 9 Electricity The EUB regulates investor-owned natural gas, electric, and water utilities and certain municipally owned electric utilities to ensure that customers receive safe and reliable service at just and reasonable rates. This regulatory role is currently in a state of evolution due to the ongoing deregulation of the natural gas and electric industries. Staff also respond to customer inquiries and complaints respecting utility matters. In addition, the EUB ensures that electric facilities are built, operated, and decommissioned in an efficient and environmentally responsible way. The Electric Utilities Act of January 1, 1996, its subsequent amendments, and its supporting regulations establish the framework for the future of Alberta s electric industry. This framework was set to facilitate the transition of Alberta s electric industry from a vertically integrated and heavily regulated utility structure to one that features competition in the generation and retail market with consumer choice. The transmission and distribution components of the electric industry in Alberta remain regulated natural monopolies. The competitive wholesale market is facilitated by the Alberta Electric System Operator (AESO) and monitored by the Market Surveillance Administrator (MSA). The AESO s main responsibilities include the planning and operation of Alberta s transmission system and ensuring that electricity generating and distribution companies, along with large industrial consumers, receive fair and open transmission access to the power grid. The MSA monitors Alberta s electricity market for fairness and balance in the public interest by ensuring that the market operates fairly, efficiently, and in an openly competitive manner. Along with the AESO and the MSA, the Balancing Pool was established in 1999 in order to help manage the financial accounts arising from the transition to a competitive generation market on behalf of electricity consumers and to meet any obligations and responsibilities associated with both sold and unsold Power Purchase Arrangements (PPAs). In 2000, in order to introduce competition to Alberta s electricity market, electricity generation from utility plants built during the era of full regulation (before 1996) were auctioned off as PPAs. These PPAs provided successful buyers with the long-term rights to sell power generated at these units directly to customers or through the power pool. Electricity generating units built after January 1, 1996, are not subject to PPAs and their generation can be bought or sold directly to the market. 9.1 Electricity Generating Capacity Provincial Summary Capacity refers to the maximum potential supply of electricity, often expressed in megawatts (MW), that can be produced each hour. Alberta s fuel mix of available electricity generating capacity is composed of coal, natural gas, hydroelectric, and renewable energy, such as wind and biomass. A relatively small amount of capacity is obtained from diesel and fuel oil-fired generators, which are used as a source of backup power for industrial use. A large majority of the natural gas-fired capacity in the province is classified as cogeneration. Cogeneration is the combined production of electricity and thermal energy EUB ST : Alberta s Energy Reserves 2006 and Supply/Demand Outlook / Electricity 9-1

164 using natural gas as a fuel source. Thermal energy is often used in manufacturing processes or for heating buildings, as such cogeneration plants are often sited alongside an industrial facility. As illustrated in Figure 9.1, the structure of Alberta s electricity industry has changed since the years prior to deregulation. In 1997, Alberta s electric generating capacity was slightly more than 8600 MW, with coal-fired facilities accounting for 66 per cent. Between 1997 and 2006, electricity generating capacity increased by 3120 MW to total MW. About 80 per cent of the incremental generating capacity was natural gasfired. In 2006, coal-fired facilities accounted for 50 per cent of Alberta s total electric generating capacity, and natural gas-fired facilities accounted for 38 per cent. Changes to Alberta s electricity generating capacity in 2006 resulted in a net loss of 330 MW. The decommissioning of EPCOR Power Development Corporation s Cloverbar gas-fired units triggered the removal of 630 MW from the EUB s estimate of Alberta s natural gas-fired generating capacity. While the entire 630 MW was accounted for in 2005, only one of the four units at Cloverbar was operating. A portion of the gross loss to capacity from the shutdown of Cloverbar was offset by capacity additions at Syncrude Canada Ltd. s Aurora and Mildred Lake gas-fired cogenerators in the Fort McMurray area, as well as additional capacity from wind turbines. The electricity generating capacity forecast includes power generation projects that are summarized by fuel source in Table 9.1. From this potential list as much as 3550 MW of capacity may be added to the provincial power grid by By the end of the forecast period, the EUB expects electricity generating capacity in Alberta to be MW. New natural gas-fired cogeneration facilities will offer the largest contribution to electricity generating capacity over the forecast period. The commissioning of new natural gas-fired cogeneration plants will coincide with the development of Alberta s oil sands resources. By 2016, electricity generation from natural gas-fired power and 9-2 EUB ST : Alberta s Energy Reserves 2006 and Supply/Demand Outlook / Electricity
165 cogeneration units could total 6850 MW, accounting for 46 per cent of Alberta s total available capacity. Table 9.1. Proposed electricity generating capacity additions, Company Fuel / type Proposed capacity (MW) 2007 Suncor Natural gas 1 85 ENMAX Wind 80 Benign Energy Canada Wind 54 Wind Power Inc/PH Wind Wind 14 Alberta Wind Energy Wind TransAlta Coal 53 OPTI/Nexen Natural gas 1,2 170 Canadian Natural Resources Natural gas Meg Energy Natural gas 1 85 EPCOR Natural gas 43 Shell Natural gas 22 TransAlta (VisionQuest) Wind Suncor Natural gas EPCOR Natural gas 100 Alberta Wind Energy Wind 47 West Windeau Wind 100 Windrise Power Wind TransAlta/EPCOR Coal 450 Shell Natural gas Suncor (multiple phases) Natural gas Imperial Oil (multiple phases) Natural gas Synenco Natural gas UTS/PetroCanada/Teck Com. Natural gas PetroCanada Natural gas Shell Natural gas EPCOR Natural gas 100 Canadian Natural Resources Natural gas 2 86 Canadian Natural Resources Natural gas 1 85 Total E&P Canada (Deer Creek) Natural gas 2 85 OPTI/Nexen Natural gas 1,2 85 Sundance Forest Industries Biomass 10 Glacier Power (Canadian Hydro) Hydro 100 Benign Energy Canada Wind 77 Total proposed generation ( ) Cogeneration for in situ bitumen project. 2 Cogeneration for bitumen mine or upgrader project. EUB ST : Alberta s Energy Reserves 2006 and Supply/Demand Outlook / Electricity 9-3
166 9.1.2 Electricity Generating Capacity by Fuel Coal In 2006, coal-fired generating units accounted for 50 per cent of Alberta s generating capacity. The current capacity of Alberta s coal generation is 5840 MW. There are proposals to develop an additional 500 MW of coal-fired electricity capacity over the next decade. With the decommissioning of TransAlta Corporation s Wabamum Unit 4, total coal-fired capacity may reach 6060 MW by 2016 and account for 40 per cent of Alberta s total generation capacity. In May 2006, TransAlta applied to the EUB to complete an uprate to capacity at one of the generating units at its Sundance coal-fired plant. Using existing infrastructure, Sundance Unit 4 will be retrofitted with a new turbine, and modifications to the boiler and electrostatic precipitators will be made in order to achieve higher operating efficiencies. At project completion, Unit 4 will be able to produce an additional 53 MW of electricity but will use less fuel on a per MW basis. A similar project was completed on Sundance Unit 6 in Work on the Unit 4 uprate project is expected to proceed in 2007 and is forecast to be completed in In 2001, TransAlta applied to the EUB to expand its Keephills coal-fired power plant to include two additional 450 MW units. This Centennial Project was approved by the EUB in However, in June 2006 TransAlta filed an amendment to the original planned expansion at Keephills. The Centennial Project, now referred to as the Keephills 3 project, proposes the construction of one 450 MW coal-fired unit that will incorporate supercritical boiler technology, featuring higher boiler temperatures and pressures. Combined with a high efficiency turbine, the unit will require less fuel and air emissions will be lower on a per MW basis. TransAlta and EPCOR have equal ownership in the Keephills 3 plant. EPCOR is responsible for the construction and TransAlta will run the facility. In February 2007, TransAlta announced that it expects to commission Keephills 3 by the end of the first quarter of Natural Gas Natural gas-fired generating capacity accounts for 38 per cent of Alberta s current total electricity capacity. The current capacity of Alberta s natural gas-fired generation is 4440 MW. Over the next 10 years, Alberta s natural gas-fired electric capacity is expected to increase by 2410 MW and will account for 46 per cent of Alberta s total generating capacity. New natural gas-fired cogeneration power plants account for about 2160 MW, or about 90 per cent of the increase in natural gas-fired capacity over the next decade. The regulatory applications that are expected to be filed with the EUB for approvals to construct and operate cogeneration facilities coincide with the development of Alberta s oil sands resources, which require large quantities of electricity and thermal energy to extract the bitumen. The forecast includes the construction and operation of cogeneration facilities for the following in situ oil sands operations: Suncor Energy Inc. s Firebag project, Meg Energy Corporation s Christina Lake project, Shell Canada Ltd. s Carmon Creek project, Canadian Natural Resources Ltd. s (CNRL) Primrose East expansion, and PetroCanada s MacKay River expansion. Cogeneration facilities that are considered part of an oil sands mine or bitumen upgrading operation include the OPTI Canada Inc. and Nexen Inc. s Long Lake projects, the CNRL Horizon project, Shell Canada s Jackpine project, the Synenco Energy Inc. s Northern Lights project, the Fort Hills joint venture (Petro- 9-4 EUB ST : Alberta s Energy Reserves 2006 and Supply/Demand Outlook / Electricity
167 Canada, UTS Energy Corporation and Teck Cominco Ltd.), the Imperial Oil Ltd. s Kearl Lake project, and the Total E&P Canada (Deer Creek) Joslyn project. In August 2006, EPCOR filed a regulatory application with the EUB that proposed the installation of new natural gas-fired turbines at its existing Cloverbar power plant. The Cloverbar generating station was built in the late 1960s and the first unit became operational in The natural gas-fired units at Cloverbar had a generating capacity of 630 MW but have since been decommissioned when the Balancing Pool of Alberta terminated the PPA for the output of the plant. EPCOR is proposing to install three natural gas-fired units at Cloverbar. The first unit, with a capacity of 43 MW, is expected to be operational by winter 2007/08. The second and third units, with capacities of 100 MW each, are planned to be operational by winter 2008/09 and winter 2010/11. Hydro Electricity from hydro sources accounted for almost 8 per cent of total capacity in The current capacity of Alberta s hydroelectric generation is approximately 900 MW. About 800 MW of this capacity is owned by TransAlta, operating 26 generating units along the Bow and North Saskatchewan Rivers. In 2006, Glacier Power, a subsidiary of Canadian Hydro Developers Inc., filed a regulatory application with the EUB to construct and operate a 100 MW hydroelectric power plant on the Peace River. Subject to regulatory approval, the Dunvegan plant could be operational in Renewable Power About 5 per cent of Alberta s current electricity capacity is classified as renewable power that includes biomass and wind. Biomass electricity is derived from plant or animal material, such as wood, straw, peat, or manure. In Alberta, the most common fuel for biomass generation is waste wood. Forestry industries typically burn waste wood as a fuel source to generate electricity and thermal energy. In 2006, Alberta biomass capacity amounted to 184 MW, less than 2 per cent of Alberta s total capacity. Sundance Forest Industries is expected to commission a 10 MW biomass-fuelled power plant within three to five years. Alberta s wind farms and turbines currently have the potential to supply a maximum of 387 MW of electricity to the grid. The electricity generating capacity from wind turbines has increased by about 110 MW since Three new wind projects were connected to the Alberta electricity grid in GW Power Corporation and Nexen s Soderglen joint project has a rated capacity of 70 MW. The Chin Chute joint project and Kettle Hills, first in a suite of projects, added 30 MW and 9 MW respectively. Wind power has its benefits as a renewable, non-emission generating source of power supply; however the variability of wind can cause supply uncertainties on the Alberta electricity grid. Solutions are available to mitigate the risk of supply and demand imbalances that can occur from wind power. Developing wind power forecasting techniques and the siting of wind turbines and wind farms may help. Having geographically dispersed wind turbines may provide some relief, because while wind might not be blowing in one area to create electricity, it could be blowing in another area. Another method that could be used to help balance electricity demand and supply from within Alberta would be to rely on the transmission interties between Alberta and other EUB ST : Alberta s Energy Reserves 2006 and Supply/Demand Outlook / Electricity 9-5
168 jurisdictions. The intertie could manage a supply and demand imbalance by flowing the imbalance to neighbouring provinces. However, Alberta complies with an international set of standards stipulating how frequently interties may be used for this purpose; as well, Alberta s interties have limited transfer capabilities. Constraining the amount of wind power development within the province is a short-term solution to balancing the supply and demand while further research specific to Alberta s market can be completed. In 2006, after consulting with industry stakeholders and studying the impacts of wind power on the Alberta electricity grid, the AESO curtailed the amount of wind power development in the province to 900 MW. A number of regulatory applications have been submitted to the EUB to construct wind turbines and wind farms within Alberta. Most recently, a number of the proposals received at the EUB did not disclose commissioning dates, citing unavailable transmission requirements, the AESO cap on wind power development in Alberta, and longer lead times on machinery and equipment. These latter projects have not been considered as part of the EUB forecast. Overall, it is expected that total wind power capacity will near 900 MW early on in the forecast. 9.2 Supply and Demand of Electricity This section discusses the supply and demand of electricity within Alberta. On the supply side, the stock of electricity or capacity is measured in watts, while the flow of electricity or generation is measured in watt hours. Electricity demand, in this report, is defined as the average annual load in Alberta measured in gigawatt hours. Electricity generation is the amount of electricity produced within a certain time period. For instance, if an electricity plant with a rated capacity of 100 MW operated at its maximum potential for one day it would supply 2.4 gigawatt hours (GWh) of electricity. Alternatively, if the same plant only supplied 1.8 GWh of electricity on a given day, the plant would be using 75 per cent of its potential capacity. In order to forecast electricity generation, the EUB uses a defined list of existing and proposed electricity generating units, electricity generating capacities, expected operating characteristics, a merit or stacking order, hourly customer load profiles, and expected electricity demand. The proposed generating units and generating capacities are discussed in the previous section. The electricity generation forecast does not incorporate PPAs that are currently known to expire within the forecast time frame, such as the December 31, 2013, expiration of EPCOR s PPA for Battle River units 3 and 4. Further, it is assumed that the province is import/export neutral. The expected operating capacity of an existing electricity generating unit is determined using its historical operating parameters, such as outage and capacity utilization rates. For instance, depending on location, the effective electricity capacity of a wind turbine can be roughly 20 to 30 per cent of its installed capacity. In the oil sands sector, the forecast of electricity generation from new generation is ramped up in a phased approach that corresponds with the expected on-site load at certain phases of bitumen or SCO production. The stacking order of electricity generation refers to the order in which electricity from each generating unit is offered in or sold to the electricity grid. The lowest marginal cost producers are expected to offer in electricity generation first. The lowest marginal cost producers include wind turbines, hydroelectric dams, and an amount of base coal-fired 9-6 EUB ST : Alberta s Energy Reserves 2006 and Supply/Demand Outlook / Electricity
169 generation. Higher marginal cost producers, such as electricity from natural gas-fired turbines (under a regime of high natural gas prices), offer electricity into the grid at times of peak demand. A more realistic electricity generation forecast is obtained by incorporating hourly load profiles and the EUB forecast of electricity demand for each year. For each year there is an 8760 hour load profile that corresponds with the expected total load. By incorporating hourly loads, generating units are dispatched hourly, which accounts for periods of high load and low load throughout each year. The EUB defines Alberta s total electricity demand as the electricity sales reported by utilities to agricultural, residential, commercial, and industrial customers, as well as the on-site use of electricity generated by industrial consumers. The EUB s definition of total electricity demand excludes transmission losses and power generation from isolated plants. As such, the EUB forecast may not match the AESO s Alberta Interconnected Electric System (AIES) forecast or its Alberta Internal Load (AIL) forecast. However, the expected growth in overall demand of the AESO AIL and EUB forecast may be comparable. The EUB uses these customer segments and econometric modelling to forecast total electricity demand. The industrial end-use customers are further categorized into the forest product, petrochemical, refinery, and oil sands sectors in order to adequately account for electricity demand growth or contraction within these industries. The key drivers of electricity demand include components of Alberta s economy represented by its gross domestic product, heating degree days, housing stock, and household income. Within the oil sands sector, expectations for bitumen and SCO production are also important drivers Electricity Generation Alberta installed capacity in 2006 was MW, enough to supply over GWh of electricity if it operated at full capacity. However, total electricity generating capacity is not continuously available to meet demand. Generating units are sometimes unavailable due to scheduled and unscheduled maintenance, forced outages, technical limitations (for instance, wind turbines), or economic reasons. Figure 9.2 illustrates total electricity generation in Alberta by fuel type, including electricity from cogeneration plants that is not sold into the Alberta Interconnected System. In 2006, total electricity generation reached GWh. Between 1997 and 2006, electricity generation in Alberta grew by GWh or, on average, 2 per cent per year. In 2006, coal-fired power plants generated 63 per cent of the province s electricity, while natural gas and hydro accounted for 31 and 3 per cent respectively. The remaining 3 per cent of electricity was generated by wind and other renewable sources. Natural gas cogeneration plants designated to the oil sands sector generated GWh of electricity. Within the oil sands, almost 6800 GWh (59 per cent) of the electricity generated was used on site, whereas the remaining was sold into the power pool. EUB ST : Alberta s Energy Reserves 2006 and Supply/Demand Outlook / Electricity 9-7

170 Wind turbines contributed 922 GWh, or about 1 per cent, of total electricity generation in The generation from wind turbines is accounted for in the other category in Figure 9.2. Wind generation constituted 48 per cent of the electricity generated in the other category, with electricity generation from biofuel accounting for most of the remaining generation in this category. The capacity additions discussed in the previous section, as well as the decommissioning of 280 MW (unit 4) at TransAlta s Wabamun coal-fired power plant in 2010 and apparent electricity demand from residential, commercial, and industrial sectors, suggest that electricity generation in Alberta will grow by an additional 25 Terawatt hours (TWh) over the next ten years, or an average of 4 per cent per year Electricity Transfers Alberta s transmission lines are connected with British Columbia (B.C.) and Saskatchewan. Alberta is interconnected with the B.C. transmission system through a 500 kilovolt (kv) line between Langdon, Alberta, and Cranbrook, B.C., and two 138 kv lines between Pocaterra and Coleman, Alberta, and Natal, B.C. Since B.C. is connected with the U.S. Pacific Northwest, the Alberta-B.C. intertie allows Alberta to indirectly trade electricity with the U.S. The 230 kv direct current electrical tie with Saskatchewan enables Alberta to import or export about 150 MW. The Alberta-B.C. interconnection was designed to operate at transfer capacities of 1200 MW from B.C. to Alberta and 1000 MW from Alberta to B.C. Current operations on the Alberta-B.C. intertie are below these capacities and range between 0 and 750 MW, depending on system load and real-time operation conditions. In addition to the transmission ties, a natural gas-fired electricity generation unit in Fort Nelson (northern B.C.) supplies power to its surrounding communities and sells surplus electricity generation into the Alberta grid. 9-8 EUB ST : Alberta s Energy Reserves 2006 and Supply/Demand Outlook / Electricity

171 Over the last decade, Alberta has generally been a net importer of electricity. However, in 2001 the electricity price differentials between Alberta and the Pacific Northwest favoured Alberta and resulted in net exports for the year. Net imports of electricity into Alberta for other years were relatively small, at about 2 per cent of Alberta generation in As a result, the electricity supply forecast assumes that the intertie contributions are neutral. Figure 9.3 shows Alberta s electricity transfers from 1997 to In 2006, Alberta imported 1704 GWh of electricity, a decrease of 1 per cent or 18 GWh from Electricity exports decreased 53 per cent, or 546 GWh, to 489 GWh in As a result, Alberta s net imports of electricity were about 1214 GWh in Source: EUB In 2006, Montana Alberta Tie Ltd. (MATL) filed regulatory applications to build a 230 kv merchant electric transmission line between Lethbridge, Alberta, and Great Falls, Montana. The transmission line would provide new and direct import and export opportunities between Alberta and Montana. The proposed MATL system is capable of transferring 300 MW of electricity in each direction. Although the MATL project has acquired certain regulatory approvals from the National Energy Board, MATL is seeking EUB approval for the construction and operation of the transmission line and related facilities within Alberta and the connection to the Alberta Interconnected Electric System. An EUB decision will be rendered following the EUB scheduled hearing. MATL held two open seasons, one in 2005 and one in 2006, that resulted in long-term, firm commitments by four shippers. The entire 300 MW capacity in each direction was awarded to Great Plains Wind Energy, Energy Logics (USA) Inc., Invenergy Wind Montana, and Wind Hunter LLC. EUB ST : Alberta s Energy Reserves 2006 and Supply/Demand Outlook / Electricity 9-9
172 9.2.3 Electricity Demand in Alberta Electricity distribution companies report their annual retail sales of electricity to the EUB. Electricity distribution companies that report to the EUB include ATCO Electric, ENMAX Corporation, EPCOR, Fortis Alberta Inc., the cities of Lethbridge, Medicine Hat, Red Deer, Cardston, Fort Macleod, Ponoka, and the municipality of Crowsnest Pass. 1 In 2006, Alberta s electricity consumption from sales reported by electricity distributors reached GWh. This is an increase of 2.7 per cent from GWh in From these sales, about 56 per cent of the electricity consumed is sold to industrial customers, while commercial customers demand 25 per cent. The remaining 16 per cent and 3 per cent of sales volumes from electricity distribution companies were attributable to the residential and agricultural sectors respectively. Residential customers consumed 8254 GWh of electricity in The electricity distribution companies have accounted for almost 1.2 million residential customers in Alberta, which translates to an electricity intensity of 6.9 MWh per residential customer. The electricity usage of the average commercial customer was 89.9 MWh in Retail sales by electricity distribution companies make up a large component of the total electricity demand within the province. However, in addition to sales from electricity distribution companies, electricity may be self-generated and served behind the fence. Many large consumers of electricity operate electricity generating units in this manner to take advantage of the associated economic benefits. They initially serve their on-site requirements and may opt to generate and sell additional electricity to the power pool. As outlined in the Hydro and Electric Energy Act (Alberta Regulation 409/83), electricity generation units with a capacity equal to or above 500 kw are required to report the unit s electricity generation, fuel use, and operating characteristics to the EUB. In 2006, almost GWh, or 64 per cent, of total electricity demand in Alberta was used by industrial consumers. As much as GWh of the electricity requirements for industrial customers was served behind the fence; the remaining GWh was sold to industrial customers by electricity distribution companies over the AIES. Figure 9.4 illustrates Alberta s electricity consumption by sector. Behind the fence load (industrial on site) for industrial processes is accounted for, in addition to the retail sales from electricity distribution companies. Including on-site electricity generation and use, total electricity demand (excluding transmission and distribution losses) in the province amounted to GWh in Compared to 2005, this is an increase of 2586 GWh, or 4 per cent. Both total electricity generation and demand in Alberta are expected to grow at average rates of 4 per cent a year over the next decade. Over the next year, very little will be added to Alberta s generation capacity, while demand is expected to increase by 3 per cent. This means that Alberta s electricity generating units will have to operate closer to capacity, and the tightening of the supply/demand balance is the underlying premise for the elevated electricity price forecast discussed in the Economics section. 1 The AESO reports retail sales from distribution companies as a component to its AIES sales, which also include transmission and distribution losses and exclude Medicine Hat sales, as well as isolated electricity loads EUB ST : Alberta s Energy Reserves 2006 and Supply/Demand Outlook / Electricity

173 Over the next ten years, residential (including agriculture) electricity demand will see an average growth of 2 per cent per year. The forecast for residential electricity demand mirrors the historical average growth in this sector. Electricity demand in the commercial sector will continue its recent course, at about 4 per cent per year, as Alberta s forecast of economic growth continues to be impressive. By the end of the forecast period, electricity demand from the industrial consumers is expected to account for 67 per cent of total electricity demand, while the commercial and residential sectors will account for the remaining 20 per cent and 14 per cent respectively. The industrial sector will be the largest source of electricity load growth, averaging almost 5 per cent per year. The oil sands sector is expected to account for 76 per cent of the load growth within the industrial sector. 9.3 Imbalances Between Electricity Supply and Demand Oil Sands Electricity Supply and Demand Figure 9.5 depicts the balance between electricity supply and demand 2 within Alberta s oil sands sector. Electricity generation from the oil sands was forecast by applying the historical operating parameters of existing electricity cogeneration units to the proposed capacities of all current and future cogeneration units. Electricity demand is based on existing electricity intensities, electricity intensities outlined in regulatory applications, and the EUB supply forecast of bitumen and SCO. A dedicated and reliable source of electricity and thermal energy is important to oil sands operators. While both mining and thermal in situ operators require electricity, the mining and upgrading operations can be much more intensive users of electricity. 2 Historical electricity demand for in situ oil sands projects that do not operate cogeneration units was estimated using an assumption of 10 kwh/bbl. EUB ST : Alberta s Energy Reserves 2006 and Supply/Demand Outlook / Electricity 9-11


174 Electricity generating units in mining and upgrading operations are initially designed to meet the electricity demand at target bitumen or SCO production capacities, as additional thermal requirements could be provided through the use of boilers. From operational start-up until target production rates are achieved, surplus electricity may be generated and sold to the power pool. Currently, operators retain between 65 to 95 per cent of the total electricity generated for on-site use. While some operations are ramping up to target production rates, others are adding incremental electricity capacity to feed growing electricity demands. Thermal in situ operators have lower requirements for electricity but are more intense users of steam. Large thermal requirements and the potential to further enhance the economics of a project via increased revenues from electricity sales have led many in situ oil sands operators to install cogeneration plants. However, in the initial phases of production, there may be fewer wellbores to steam and lower total steam requirements. Therefore, investments in a cogeneration facility at a thermal in situ project site may be postponed until secondary phases, when the production of bitumen has had some time to ramp up. In this case, the alternative to the cogeneration of electricity and thermal energy is to source the thermal energy requirements from steam generators and boilers and the electricity from the provincial power grid. Currently, four thermal in situ oil sands producers are obtaining steam from on-site cogeneration facilities. The installed electricity generation capacity at each of these thermal operations ranges between 80 and 170 MW. On average, thermal in situ cogeneration facilities are operating at 85 per cent of their installed capacity. Depending of the size of the thermal in situ oil sands operation, anywhere from 10 to 50 per cent of the electricity generated is used on site, and the remainder is available to be sold to the power pool EUB ST : Alberta s Energy Reserves 2006 and Supply/Demand Outlook / Electricity
ST Alberta's Energy Reserves 2008 and Supply/Demand Outlook
 ST98-2009 Alberta's Energy Reserves 2008 and Supply/Demand Outlook 2009-2018 0 Energy Resources Conservation Board ACKNOWLEDGEMENTS The following ERCB staff contributed to this report. Principal Authors:
Alberta s Reserves 2002 and Supply/Demand Outlook
 Statistical Series 2003-98 Alberta s Reserves 2002 and Supply/Demand Outlook 2003-2012 Crude Bitumen Crude Oil Natural Gas and Liquids Coal Sulphur Alberta Energy and Utilities Board Statistical Series
ST Alberta s Energy Reserves 2010 and Supply/Demand Outlook
 ST98-2011 Alberta s Energy Reserves 2010 and Supply/Demand Outlook 2011-2020 ACKNOWLEDGEMENTS The following ERCB staff contributed to this report. Principal Authors: Reserves Andy Burrowes, Michael Teare,
ST98: 2018 ALBERTA S ENERGY RESERVES & SUPPLY/DEMAND OUTLOOK. Executive Summary.
 ST98: 2018 ALBERTA S ENERGY RESERVES & SUPPLY/DEMAND OUTLOOK Executive Summary ST98 www.aer.ca EXECUTIVE SUMMARY The Alberta Energy Regulator (AER) ensures the safe, efficient, orderly, and environmentally
ST98: 2018 ALBERTA S ENERGY RESERVES & SUPPLY/DEMAND OUTLOOK. Executive Summary.
 ST98: 2018 ALBERTA S ENERGY RESERVES & SUPPLY/DEMAND OUTLOOK Executive Summary ST98 www.aer.ca EXECUTIVE SUMMARY The Alberta Energy Regulator (AER) ensures the safe, efficient, orderly, and environmentally
ST Alberta s Energy Reserves 2011 and Supply/Demand Outlook
 ST98-2012 Alberta s Energy Reserves 2011 and Supply/Demand Outlook 2012 2021 ACKNOWLEDGEMENTS The following ERCB staff contributed to this report: Principal Authors: Reserves Michael Teare, Andy Burrowes,
Short Term Energy Outlook March 2011 March 8, 2011 Release
 Short Term Energy Outlook March 2011 March 8, 2011 Release Highlights West Texas Intermediate (WTI) and other crude oil spot prices have risen about $15 per barrel since mid February partly in response
Canada s Energy Future: Energy Supply and Demand Projections to Emerging Fuels and Energy Efficiency Highlights
 Canada s Energy Future: Energy Supply and Demand Projections to 2035 - Emerging Fuels and Energy Efficiency Highlights Canada s Energy Future: Energy Supply and Demand Projections to 2035 Emerging Fuels
AEO2005 Overview. Key Energy Issues to Economic Growth
 Key Energy Issues to 225 The Energy Information Administration (EIA), in preparing model forecasts for its Annual Energy Outlook 25 (AEO25), evaluated a wide range of current trends and issues that could
ENERGY OPEC ECONOMIC REPORT AND BALANCE SHEET 1395 CHAPTER
 ECONOMIC REPORT AND BALANCE SHEET 395 CHAPTER 3 C rude oil prices followed a fluctuating trend in the international market in 206, bringing the total average price of each barrel to less than 205 levels.
Short-Term and Long-Term Outlook for Energy Markets
 Short-Term and Long-Term Outlook for Energy Markets Guy Caruso Administrator, Energy Information Administration guy.caruso@eia.doe.gov Fueling the Future: Energy Policy in New England December 2, 25 Boston,
ENVIRONMENT AND ENERGY BULLETIN
 ENVIRONMENT AND ENERGY BULLETIN Vol. 3 No. 2 June 2011 Editor: Jock A. Finlayson THE NATURAL GAS STORY Both globally and in North America, natural gas is poised to play a bigger role in meeting the energy
ENERGY OPEC ECONOMIC REPORT AND BALANCE SHEET 1391 CHAPTER
 ECONOMIC REPORT AND BALANCE SHEET 39 CHAPTER 3 I n 202 and the first quarter of 203, international crude oil prices followed a fluctuating trend. A host of factors were responsible for the fluctuations
Overview. Key Energy Issues to Economic Growth
 Key Energy Issues to 225 The Energy Information Administration (EIA), in preparing model forecasts for its Annual Energy Outlook 25 (AEO25), evaluated a wide range of current trends and issues that could
American Strategy and US Energy Independence
 Cordesman: Strategy and Energy Independence 10/21/13 1 American Strategy and US Energy Independence By Anthony H. Cordesman October 21, 2013 Changes in energy technology, and in the way oil and gas reserves
Fuel Focus. Understanding Gasoline Markets in Canada and Economic Drivers Influencing Prices. Issue 18, Volume 9
 Fuel Focus Understanding Gasoline Markets in Canada and Economic Drivers Influencing Prices Issue 18, Volume 9 October 3, 14 Copies of this publication may be obtained free of charge from: Natural Resources
Impact of American Unconventional Oil and Gas Revolution
 National University of Singapore Energy Studies Institute 18 May 215 Impact of American Unconventional Oil and Gas Revolution Edward C. Chow Senior Fellow Revenge of the Oil Price Cycle American Innovation:
WORLD ENERGY OUTLOOK 2005 Middle East & North Africa Insights
 WORLD ENERGY OUTLOOK 2005 Middle East & North Africa Insights Nicola Pochettino Senior Energy Analyst Global Energy Trends: Reference Scenario International Energy Price Assumptions The assumed oil-price
National Overview. In this Issue. Recent Developments. Volume 2, Issue 3. Figure 1: Crude Oil and Regular Gasoline Price Comparison (National Average)
") Fuel Focus February 16, 27 National Overview Slight Increase in Canadian Retail Gasoline Prices from Last Week The Canada average retail gasoline price increased marginally to 87 cents per litre for the
Fuel Focus February 16, 27 National Overview Slight Increase in Canadian Retail Gasoline Prices from Last Week The Canada average retail gasoline price increased marginally to 87 cents per litre for the
U.S. oil and natural gas outlook
 U.S. oil and natural gas outlook New York, NY By Adam Sieminski, EIA Administrator U.S. Energy Information Administration Independent Statistics & Analysis www.eia.go v The U.S. has experienced a rapid
US Oil and Gas Import Dependence: Department of Energy Projections in 2011
 1800 K Street, NW Suite 400 Washington, DC 20006 Phone: 1.202.775.3270 Fax: 1.202.775.3199 Email: acordesman@gmail.com Web: www.csis.org/burke/reports US Oil and Gas Import Dependence: Department of Energy
A HISTORIC SHIFT TO GOOD TIMES?
 RICE GLOBAL E&C FORUM A HISTORIC SHIFT TO GOOD TIMES? Oil Pricing Outlook Alessandro Lanza, PhD Chief Economist, Eni 1 Houston, October 11, 2005 Summary Key factors in oil price dynamics Supply Refining
Black Gold: America and Oil 9/23/08 NOTES 9/18/08 POSTED & ASSIGNMENT #4 INTER/EXTRAPOLATION & EXP. GROWTH?
 Black Gold: America and Oil 9/23/08 NOTES 9/18/08 POSTED & ASSIGNMENT #4 INTER/EXTRAPOLATION & EXP. GROWTH? Questions Is America / world running out of oil? Can the US be energy-independent? U.S. Energy
The Outlook for the Global LPG Market
 The Outlook for the Global LPG Market International LP Gas Seminar 213 Ken Otto February 28, 212 Dai-Ichi Hotel Tokyo, Japan 212, IHS Inc. No portion of this presentation may be reproduced, reused, or
FROM RAILROAD COMMISSIONER RYAN SITTON
 2018 E N E R G Y M A R K E T O U T L O O K FROM RAILROAD COMMISSIONER RYAN SITTON TABLE OF CONTENTS 2018 ENERGY MARKET OUTLOOK Summing up the analysis contained in this report in a few sentences, my prediction
The Unconventional Oil and Gas Market Outlook
 The Unconventional Oil and Gas Market Outlook The future of oil sands, shale gas, oil shale and coalbed methane Report Price: $2875 Publication Date: July 2010 E N E R G Y The Unconventional Oil and Gas
U.S. EIA s Liquid Fuels Outlook
 U.S. EIA s Liquid Fuels Outlook NCSL 2011 Energy Policy Summit: Fueling Tomorrow s Transportation John Staub, Team Lead August 8, 2011 San Antonio, Texas U.S. Energy Information Administration Independent
Short-Term Energy Outlook (STEO)
") May 2013 Short-Term Energy Outlook (STEO) Highlights Falling crude oil prices contributed to a decline in the U.S. regular gasoline retail price from a year to date high of $3.78 per gallon on February
May 2013 Short-Term Energy Outlook (STEO) Highlights Falling crude oil prices contributed to a decline in the U.S. regular gasoline retail price from a year to date high of $3.78 per gallon on February
The Canadian Oil Sands in the Context of the Global Energy Demand
 Extended Abstract for 17 th Convocation of the International Council of Academies of Engineering and Technological Sciences (CAETS), Tokyo, Japan, October 2007. The Canadian Oil Sands in the Context of
Canada s Oil Sands. Energy Security. Environmental Sustainability. Economic Growth and Jobs. Shifting Supply and Demand
 Canada s Oil Sands Canada s Oil Sands Energy Security Shifting Supply and Demand the world is counting on Canada s oil Access to existing and new markets Environmental Sustainability Greenhouse gas emissions
Fuel Focus. National Overview. In this Issue. Recent Developments. Volume 2, Issue 10 May 25, 2007
 Fuel Focus Volume 2, Issue 1 May 2, 7 National Overview Strong Wholesale Gasoline Prices Maintain Upward Pressure on the Retail Side Figure 1: Crude Oil and Regular Gasoline Price Comparison (National
WHAT EVER HAPPENED TO PEAK OIL? Benedikt Unger, February 2015
 WHAT EVER HAPPENED TO PEAK OIL? Benedikt Unger, February 2015 WHAT EVER HAPPENED TO PEAK OIL 2 PART 1 OIL FUNDAMENTALS WHAT EVER HAPPENED TO PEAK OIL 3 WHAT ABOUT PEAK OIL? The discussion about oil running
Research Projects as of March 27, 2018
 2017-2018 Research Projects as of March 27, 2018 CARBON MANAGEMENT IMPACTS ON ELECTRICITY MARKETS IN CANADA This project is designed to gain insights into challenges and opportunities carbon management
Power & Politics Navigating the Changing Vision of Our Energy Future. Rayola Dougher, API Senior Economic Advisor,
 Power & Politics Navigating the Changing Vision of Our Energy Future Rayola Dougher, API Senior Economic Advisor, dougherr@api.org U.S. oil and natural gas production is increasing as a result of technological
North American Midstream Infrastructure Through 2035 A Secure Energy Future. Press Briefing June 28, 2011
 North American Midstream Infrastructure Through 2035 A Secure Energy Future Press Briefing June 28, 2011 Disclaimer This presentation presents views of ICF International and the INGAA Foundation. The presentation
Energy Prospectus Group
 Energy Prospectus Group Founded in 2001 Current Membership is 530 We have members in 38 states and eight countries ~ 60% of our members live in Texas Mission is to help our members make money Luncheons
INTERNATIONAL ENERGY AGENCY WORLD ENERGY INVESTMENT OUTLOOK 2003 INSIGHTS
 INTERNATIONAL ENERGY AGENCY WORLD ENERGY INVESTMENT OUTLOOK 2003 INSIGHTS Global Strategic Challenges Security of energy supplies Threat of environmental damage caused by energy use Uneven access of the
Alberta s Energy Markets: Opportunities and Challenges. Paul Tsounis Alberta Department of Energy Economics and Markets Branch June 2012
 1 Alberta s Energy Markets: Opportunities and Challenges Paul Tsounis Alberta Department of Energy Economics and Markets Branch June 2012 Key Issues of the Day Uncertainties in Europe Greek elections GDP
SIEPR policy brief. The End of Expensive Oil? By Frank A. Wolak. Stanford University March 2015
 SIEPR policy brief Stanford University March 2015 Stanford Institute for Economic Policy Research on the web: http://siepr.stanford.edu The End of Expensive Oil? By Frank A. Wolak 1. The North American
APPENDIX C FUEL PRICE FORECASTS
 APPENDIX C FUEL PRICE FORECASTS BACKGROUND Since the Council s 1991 Power Plan, fuel prices have been following the low forecast. Figure C-1 illustrates this for world oil prices, and similar patterns
The Future of Oil. It s a Fossil-Fueled World
 The Future of Oil Roland N. Horne Energy Resources Engineering Stanford University 1 It s a Fossil-Fueled World 6% 6% 29% 35% Oil Natural Gas Coal Nuclear Hydroelectric 24% BP Statistical Review 2008 2
387th IEEJ Research Report Meeting Summary June 15, 2004
 387th IEEJ Research Report Meeting Summary June 15, 2004 Recent International Political/Economic Situation and Oil Price Trends - Keynote Speech: Background Factors of the Recent Steep Rise in Oil Price
U.S. Crude Oil, Natural Gas, and NG Liquids Proved Reserves
 1 of 5 3/14/2013 11:37 PM U.S. Crude Oil, Natural Gas, and NG Liquids Proved Reserves With Data for Release Date: August 1, 2012 Next Release Date: March 2013 Previous Issues: Year: Summary Proved reserves
Unconventional Oil & Gas: Reshaping Energy Markets
 Unconventional Oil & Gas: Reshaping Energy Markets Guy Caruso Senior Advisor JOGMEC Seminar 7 February 2013 Landscape is Changing Even as We Sit Here Today - US Projected to reach 90% Energy Self-Sufficiency
The Outlook for Energy: A View to 2040
 The Outlook for Energy: A View to 2040 Rob Gardner March 2014 This presentation includes forward looking statements. Actual future conditions (including economic conditions, energy demand, and energy supply)
Annual Energy Outlook 2015
 Annual Energy Outlook 215 for Asia Pacific Energy Research Centre Annual Conference 215 Tokyo, Japan by Sam Napolitano Director of the Office of Integrated and International Energy Analysis U.S. Energy
5. Empirical Results. 5.1 Event study analysis
 5. Empirical Results 5.1 Event study analysis Our main empirical results of event study are presented in the following sections. Rather than report full details of the event study results, we only provide
Natural Gas. Tuesday, May 1, 2012; 4:00 PM 5:15 PM
 Natural Gas Tuesday, May 1, 2012; 4:00 PM 5:15 PM Moderator: Joel Kurtzman, Senior Fellow and Executive Director of the Center for Accelerating Energy Solutions, Milken Institute Speakers: Ralph Eads,
Energy Availability and the Future of the Fertilizer Industry. Rayola Dougher API Senior Economic Advisor
 Energy Availability and the Future of the Fertilizer Industry Rayola Dougher API Senior Economic Advisor dougherr@api.org Energy: the engine of our economic growth 1974 1980 1986 1992 1998 2004 2010 2016
BP Energy Outlook 2035
 BP Energy Outlook 235 Focus on North America, March 215 bp.com/energyoutlook #BPstats Disclaimer This presentation contains forward-looking statements, particularly those regarding global economic growth,
Canada s oil sands the in situ producers perspective
 Canada s oil sands the in situ producers perspective February 11, 2010 By: Chris Bloomer (Presented by: Gerald W. Bruce, IOSA member) IOSA Member Petrobank Who is IOSA? In situ Oil Sands Alliance Independent
ENERGY IN BIG LAKES COUNTY ANOTHER BOOM IS COMING! GO BIGLAKESCOUNTY.CA A COST EFFECTIVE GATEWAY A PRODUCTIVE AREA ALBERTA S TOP EXPORTS
 A COST EFFECTIVE GATEWAY A PRODUCTIVE AREA ALBERTA S TOP EXPORTS A KNOWLEDGELE WORKFORCE DIVERSIFIED AND INNOVATIVE ENERGY IN BIG LAKES COUNTY GO BIGLAKESCOUNTY.CA ANOTHER BOOM IS COMING! Since 2015, the
World and U.S. Fossil Fuel Supplies
 World and U.S. Fossil Fuel Supplies Daniel O Brien and Mike Woolverton, Extension Agricultural Economists K State Research and Extension Supplies of fossil fuel resources used for energy production vary
The Market in The International Oil Market. The Market in The Market today. A paradigm shift
 The Market in 2004 The International Oil Market A paradigm shift Presentation by Anthony D Owen Reserve Bank of Australia, 10 May 2006 Surplus production capacity dropped sharply as a result of a sharp
A Top Analyst: North America Heading to Energy Independence
 A Top Analyst: North America Heading to Energy Independence June 26, 2012 by Robert Huebscher Is North America on the verge of energy independence? At least one analyst thinks so. Ed Morse, a managing
THE OUTLOOK FOR UNCONVENTIONAL FUELS
 THE OUTLOOK FOR UNCONVENTIONAL FUELS Roger H. Bezdek, Ph.D. Management Information Services, Inc. rbezdek@misi-net.com Presented at the Conference Integrating Energy Policy and Climate Policy Sponsored
Reality Math Dot Sulock, University of North Carolina at Asheville
 Reality Math Dot Sulock, University of North Carolina at Asheville World Oil II 1. US Oil Imports At the time of this graph, the US imported about 60% of its oil. Where we import this oil from is shown
OPEC's Spare Crude Oil Capacity - Will it Disappear by the End of 2011?
 OPEC's Spare Crude Oil Capacity - Will it Disappear by the End of 2011? Posted by Rune Likvern In this post I present an analysis of how OPEC oil supplies have responded to changes in crude oil prices
UNDERSTANDING NATURAL GAS MARKETS. Mohammad Naserifard MSc student of Oil & Gas Economics at PUT Fall 2015
 UNDERSTANDING NATURAL GAS MARKETS Mohammad Naserifard MSc student of Oil & Gas Economics at PUT Fall 2015 Table of Contents 3 Overview Natural Gas is an Important Source of Energy for the United States.
January Christof Rühl, Group Chief Economist
 January 213 Christof Rühl, Group Chief Economist Contents Introduction Global energy trends Outlook 23: Fuel by fuel Implications Energy Outlook 23 BP 213 Introduction Global energy trends Outlook 23:
Canada s Oil Sands - A World-Scale Hydrocarbon Resource
 Canada s Oil Sands - A World-Scale Hydrocarbon Resource Prepared by: R.B. (Bob) Dunbar, P. Eng. bob.dunbar@strategywest.com February 2009 www.strategywest.com PO Box 76037; Calgary, Alberta T2Y 2Z9; Phone
An INDEPENDENT energy consulting company since 1996 No affiliation with any marketer, broker, agent, utility, pipeline or producer.
 An INDEPENDENT energy consulting company since 1996 No affiliation with any marketer, broker, agent, utility, pipeline or producer. More than two decades of experience in the natural gas and electric industries
Accelerated Depletion: Assessing Its Impacts on Domestic Oil and Natural Gas Prices and Production
 SR/OIAF/2000-04 : Assessing Its Impacts on Domestic Oil and Natural Gas Prices and Production July 2000 Energy Information Administration Office of Integrated Analysis and Forecasting U.S. Department of
Let's get non-technical: An economist's take on the past, the present, and the future of the industry
 Let's get non-technical: An economist's take on the past, the present, and the future of the industry Erkal Ersoy e.ersoy@hw.ac.uk www.erkalersoy.co.uk Agenda» The market > The petroleum industry > Supply
Short-Term Energy and Summer Fuels Outlook (STEO)
") April 2013 Short-Term Energy and Summer Fuels Outlook (STEO) Highlights During the April through September summer driving season this year, regular gasoline retail prices are forecast to average $3.63
April 2013 Short-Term Energy and Summer Fuels Outlook (STEO) Highlights During the April through September summer driving season this year, regular gasoline retail prices are forecast to average $3.63
AIChE: Natural Gas Utilization Workshop Overcoming Hurdles of Technology Implementation
 AIChE: Natural Gas Utilization Workshop Overcoming Hurdles of Technology Implementation Natural Gas in the United States: An Overview of Resources and Factors Affecting the Market November 2, 216 Justin
Shale Gas Global. New Zealand LPG
 Shale Gas Global New Zealand LPG New Zealand LPG Where to from here? 2 LPG ('000 Tonnes) 300 LPG Production and Demand to 2018 (calendar year) 250 200 150 100 50 0 2000 2005 2010 2015 Kapuni Kupe McKee/Mangahewa
Presentation. at the. Bank of Canada. Ottawa, 21 July Antoine Halff
 Presentation at the Bank of Canada Ottawa, 21 July 2014 Antoine Halff The oil market at a junction Balances loosen up on paper but must be seen in perspective The unconventional supply revolution enters
NORTH AMERICAN NATURAL GASOLINE
 NORTH AMERICAN & NATURAL GASOLINE Condensate Outlook KEY TAKEAWAYS NORTH AMERICAN NATURAL GASOLINE & Condensate Outlook Overview Only Contact BENTEK to subscribe. For more information about BENTEK's industry-leading
Global Gasoline, Global Condensate and Global Petrochemical Markets to 2020 and How much naphtha will end up in gasoline blending?
 Study Prospectus Nexus - The Interaction Between: Global Gasoline, Global Condensate and Global Petrochemical Markets to 2020 and 2025 Can I export more naphtha? Should I build a splitter? Should I build
Recent Developments in Global Crude Oil and Natural Gas Markets
 Recent Developments in Global Crude Oil and Natural Gas Markets Kenneth B Medlock III, PhD James A Baker III and Susan G Baker Fellow in Energy and Resource Economics, and Senior Director, Center for Energy
Natural Gas Facts & Figures. New Approach & Proposal
 Natural Gas Facts & Figures New Approach & Proposal 1. Production and reserves Sources : Total G&P, WOC1, IEA, IHS Cera, Resources- Reserves o Conventional o Unconventional : types and reserves Countries,
17 th February 2015 BP Energy Outlook bp.com/energyoutlook #BPstats BP p.l.c. 2015
 17 th February 215 BP bp.com/energyoutlook #BPstats Economic backdrop GDP Trillion, $211 PPP 24 Other Non-OECD Asia 18 OECD Contribution to GDP growth Trillion $211 PPP, 213-35 9 Population Income per
International Energy Outlook 2011
 International Energy Outlook 211 Center for Strategic and International Studies, Acting Administrator September 19, 211 Washington, DC U.S. Energy Information Administration Independent Statistics & Analysis
 Medium Term Energy Market Outlook IEEJ Energy Seminar October 213 Keisuke Sadamori, Director, Energy Markets & Security, IEA Primary Energy Supply from Fossil Fuels Mtoe 5 45 4 35 3 25 2 15 1 5 2 21 22
COMPARATIVE ANALYSIS OF MONTHLY REPORTS ON THE OIL MARKET
 COMPARATIVE ANALYSIS OF MONTHLY REPORTS ON THE OIL MARKET AN INTERNATIONAL ENERGY FORUM PUBLICATION APRIL 2018 RIYADH, SAUDI ARABIA APRIL 2018 SUMMARY FINDINGS FROM A COMPARISON OF DATA AND FORECAST ON
Natural Gas Issues and Emerging Trends for the Upcoming Winter and Beyond
 Natural Gas Issues and Emerging Trends for the Upcoming Winter and Beyond 2013 NASEO WINTER ENERGY OUTLOOK CONFERENCE November 1, 2013 Kevin Petak Vice President, ICF International Kevin.Petak@icfi.com
Chevron: A Focused Leader in Heavy Oil
 Chevron: A Focused Leader in Heavy Oil Gary Luquette President, North America Exploration and Production May 5, 2008 JPMorgan Annual Energy Symposium: Heavy Oil Cautionary Statement CAUTIONARY STATEMENTS
Nitrogen Outlook. Forward-Looking Statements. Fertilizer Industry Roundtable. Presented to:
 Presented to: Fertilizer Industry Roundtable By: Michael Bennett, President and CEO Terra Industries Inc. Forward-Looking Statements Information contained in this presentation, other than historical information,
As discussed in Chapters 2 and 5, energy fuel
 C H A P T E R 8 Energy and Fuels As discussed in Chapters 2 and 5, energy fuel mix and energy intensity (shaped by economic structure and energy efficiencies) play important roles as drivers of CO 2 emissions.
Examining the Expansion Potential of the Petrochemical Industry in Canada
 Canadian Energy Research Institute Examining the Expansion Potential of the Petrochemical Industry in Canada Allan Fogwill President and CEO Canadian Energy Research Institute January 2016 1 Canadian Energy
Alberta s Oil Sands Resources, Production Growth,Products and Markets
 Alberta s Oil Sands Resources, Production Growth,Products and Markets Duke du Plessis. Senior Advisor Alberta Economic Development and Alberta Energy Research Institute Calgary, Alberta, Canada October
International Energy Outlook 2017
 International Energy Outlook 217 September 14, 217 Table of contents Page Overview 3 Petroleum and other liquids 31 Natural gas 47 Coal 61 Electricity 75 Buildings 91 Industrial 15 Transportation 117 Energy-related
Heavy Liquid Hydrocarbons: Their Production and the Resulting CO 2 Footprint
 Heavy Liquid Hydrocarbons: Their Production and the Resulting CO 2 Footprint Tony Kovscek Stanford University Energy Resources Engineering email:kovscek@stanford.edu First, a little quiz Where does imported
The Outlook for Energy
 The Outlook for Energy A View to 23 Flexible Packaging Association March 1 th, 26 Jesse Tyson President, ExxonMobil Inter-America Inc. This presentation includes forward-looking statements. Actual future
The following are exact quotes. Notable highlights are in Bold.
 Highlights from GAO-07-283: CRUDE OIL - Uncertainty about Future Oil Supply Makes It Important to Develop a Strategy for Addressing a Peak and Decline in Oil Production. EMBARGOED UNTIL 11:30 am Eastern
Short-Term Energy and Winter Fuels Outlook
 October 2012 Short-Term Energy and Winter Fuels Outlook EIA projects average household expenditures for heating oil and natural gas will increase by 19 percent and 15 percent, respectively, this winter
Heavy Crude Oil: A Global Analysis and Outlook to 2030
 Heavy Crude Oil: A Global Analysis and Outlook to 2030 November 2010 Prepared by: Hart Energy Consulting Hart Energy Consulting 1616 S. Voss, Suite 1000 Houston, Texas 77057, USA All rights reserved Hart
Enabling Unconventional Resources
 Enabling Unconventional Resources 8 th U.S. - China Oil and Gas Industry Forum San Francisco, California U.S.A. September 9-11, 2007 ROLE OF UNCONVENTIONAL Increasing contribution by unconventional resources
Short Term Energy Outlook
 May 2008 Short Term Energy Outlook May 6, 2008 Release Highlights West Texas Intermediate (WTI) crude oil spot prices increased from $101 to $120 per barrel over the first 3 weeks of April as supply disruptions
Assessing Today's Supplies to Fuel Tomorrow's Growth
 WORLD ENERGY OUTLOOK - INSIGHTS Assessing Today's Supplies to Fuel Tomorrow's Growth Dr. Fatih Birol Head, Economic Analysis Division International Agency / OECD World Series World 1998 World 1999 Looking
Fuels Gaseous Liquid Solid. Nuclear. Electricity, Heating, and Cooling? Cheryl Gomez, PE, MBA, LEED AP BD+C
 Cheryl Gomez, PE, MBA, LEED AP BD+C Fuels Gaseous Liquid Solid Nuclear Electricity, Heating, and Cooling? Source: US Energy Information Administration Solar, 0.2% Geothermal, 0.4% Petroleum, 1% Other Gases,
Global Energy Assessment: Shale Gas and Oil
 Global Energy Assessment: Shale Gas and Oil KEEI September, 2014 Yonghun Jung Shale Gas: a new source of energy Shale gas deposits around the world vs. 2009 natural gas consumption (tcf) U.S. 862 22.8
Oil and natural gas: market outlook and drivers
 Oil and natural gas: market outlook and drivers for American Foundry Society May 18, 216 Washington, DC by Howard Gruenspecht, Deputy Administrator U.S. Energy Information Administration Independent Statistics
The IEA s Gas 2017 Report - LNG moves to the front
 The IEA s Gas 2017 Report - LNG moves to the front Peter Fraser, Head of the Gas, Coal and Power Division EMART Energy, Amsterdam, 5 October 2017 IEA Gas in today s world The contribution of gas Versatile
Water for Onshore Oil & Gas
 TABLE OF CONTENTS Water for Onshore Oil & Gas Publication information ii Executive summary Global oil and gas water management market, 2014 Services US water management services, 2011 2020 Global drivers
IHS LATIN AMERICA LPG SEMINAR
 ENTERPRISE PRODUCTS PARTNERS L.P. IHS LATIN AMERICA LPG SEMINAR November 8, 2016 Joseph Fasullo Manager, International NGLs ALL RIGHTS RESERVED. ENTERPRISE PRODUCTS PARTNERS L.P. enterpriseproducts.com
Energy Security, Climate and Your Car: U.S. Energy Policy and Beyond
 Energy Security, Climate and Your Car: U.S. Energy Policy and Beyond Amy Myers Jaffe Wallace S. Wilson Fellow in Energy Studies and Kenneth B. Medlock III Fellow in Energy Studies James A. Baker III Institute
The outlook and opportunities for petrochemicals based on China s development of shale gas
 China s shale gas The outlook and opportunities for petrochemicals based on China s development of shale gas LEE FAGG Nexant Nexant has recently completed a detailed analysis of the current and developing
Oil Supply and Demand in Canada s Energy Future: Current Context and Long Term Trends
 p.42 Oil Supply and Demand in Canada s Energy Future: Current Context and Long Term Trends By Matthew Hansen, Chris Doleman and Abha Bhargava Introduction The authors are with Canada is a large global