U.S Shale Gas Update
|
|
|
- Reynold Griffith
- 6 years ago
- Views:
Transcription

1 U.S Shale Gas FlexPO Conference Shanghai, China 1560 W. Bay Area Blvd., Suite 195, Friendswood, TX 77546, USA Tel. (281) ,
2 Shale Gas Formations 2 Traditional gas production was based on vertical drilling into formations of gas associated with crude oil or into areas with dry gas, the location of drilling area was critical Tight oil and gas formations associated with sedimentary shale have been known for decades but was thought to be uneconomic to recover Mitchell Energy and Devon pioneered directional drilling and fracking in the early 2000 s and commercialized and improved the technology beginning in the Barnett, TX and Haynesville, LA areas Directional drilling was a key aspect as this allowed feedback to drillers to optimize routing of drill bore. Once the desired shale location was reached, the drill bore is then oriented horizontally to expose more of the formation for access to production.


3 Shale Gas Technology 3 Shale formations that have tight oil or tight gas are dissimilar in nature and the optimum method for extracting hydrocarbons will vary from formation to formation The formation porosity and rock compositions vary greatly. For instance, the Monterey shale in California is relatively dense and geologically complex In general, shale gas formations contain a higher level of NGLs as compared to dry gas formations, and thus give an economic uplift to natural gas production economics For each formation, the optimum use of proppants, frack sands, acidizing, fracking techniques will vary and thus a learning curve will be seen that will improve well productivity over time. Shale gas technology is highly differentiated. Shale gas drilling in inherently more productive that vertical wells as multiple wells can be drilled from the same platform While well depletion can be as much as 30% per year for new wells, producers can re-frack wells multiple times and re-new production rates
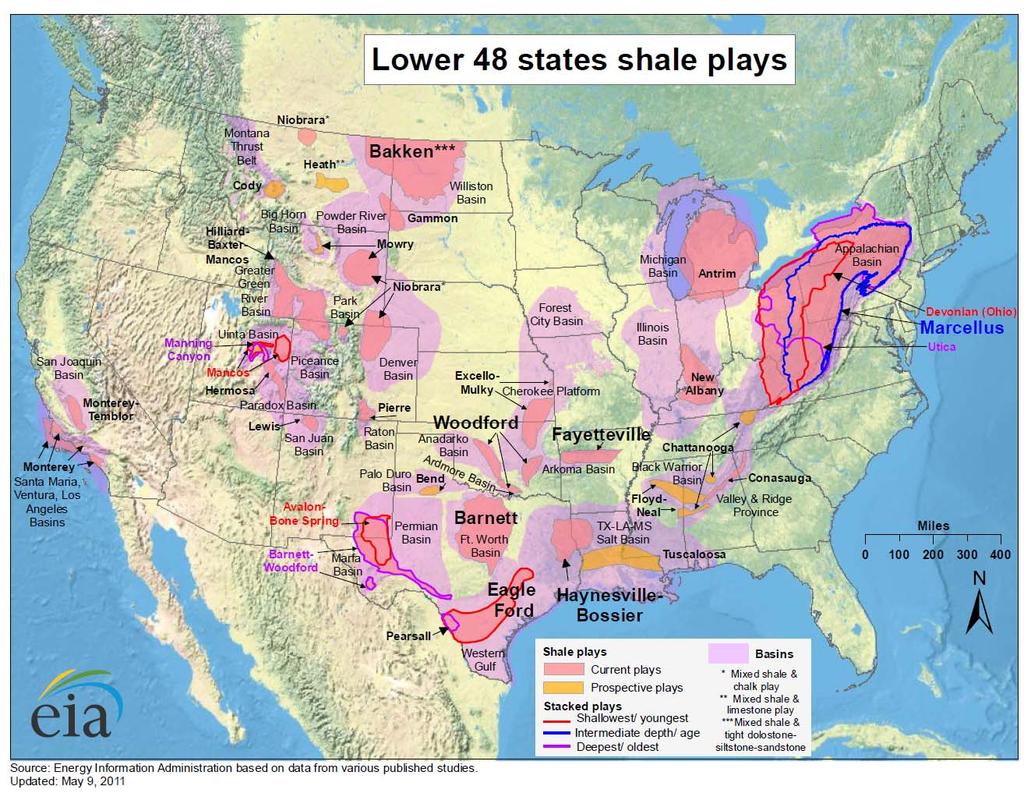
4 Basins 4

5 Shale Strata Represents Multiple Opportunities 5 Shale layers deposited at different geologic times and may be found in the same geographic areas The Marcellus and Utica shales are examples of this and are located in the Pennsylvania, West Virginia, and Ohio areas The Marcellus shale is a Middle Devonian formation, rich in organic, low-density deposits In eastern Ohio, the Utica shale is only 2,000 feet below the Marcellus formation, but is 6,000 feet below in southcentral Pennsylvania In West Texas, the newly discovered Wolfcamp shale deposit represents a potential major opportunity that is located in the Permian area Source: Geology.com


6 Shale Gas Fundamentals 6 Conventional gas is either associated with crude oil deposits or found in dry gas formations Tight gas associated with sandstone and shale formations is made accessible through hydro-fracking that breaks up rock Proppants and other completion techniques keep formations open and reduce initial depletion rates Directional drilling optimizes bore location through feedback Drill bit can be re-routed and redirected Horizontal orientation greatly expands production zone Optimum completion technology varies with specific deposit geology and a significant learning curve will often greatly improve productivity One rig can drill a well in 15 days
7 NGL Content of Shale Plays Ave NGL Content of Wet Gas, e GPM Source: EIA and analysis Formation Area GPM (1) Bone Springs and Avalon Shale West Texas Granite Wash North Texas Barnett East Texas Permian West Texas Sand Hills SAOU Versado Wolfberry 6.0 Canyon Sands 7.5 1) gallons per million SCF Source: Targa presentation, Wells Fargo - Dec , 2013 Historically, the average content of US natural gas has been about 1.5 gallons of total NGLs per million SCF of dry gas Recently, average content has moved up as wetter shale gas has begun to displace dry gas GPM is gallons per gallons per million SCF Natural gas prices near $2/MM BTU seen in early 2012 resulted in the shut-in of dry wells in the Rockies; once a well is shut, it may not have sufficient economics to re-start Natural gas prices of $4.50 to $6.00 per million BTU support shale development Shale formations tend to have higher NGL content than US average compositions Some formations have as much as 10 GPM The East Marcellus is typically NGL rich and in the West Marcellus area NGL content falls off significantly Dry gas can have less that 1 GPM The NGL content provides a value uplift that improves gas production economics
8 Shale Gas Reserves 8 Technically Recoverable Reserves Gas Rank Country Shale Gas (TCF) Shale Oil (Bbl) 1 China 1, Argentina Algeria United States Canada Mexico Australia South Africa Russia Brazil Source: EIA Others 1, World Total 7, , Proven Reserves, TCF Formation 2012 Production Reserves Marcellus/Utica Barnette Texas Louisiana Salt Western Gulf Anadarko Arkoma Sub-total Other shale gas plays All U.S. Shale Plays Source: EIA
9 Why did the US take the lead? 9 In the mid-2000 s the US chemical industry was hit with shortages of natural gas and high-priced imported oil. Natural gas hit $12 per million BTUs and crude oil hit $150/bbl. There was certainly the economic incentive for innovation Historically, 70% of US ethylene crackers were based on NGLs. The US gas industry has developed an extensive infrastructure on collection systems, pipelines, gas treatment, and fractionation facilities that remained in-place during the downturn. In the US, land owners have mineral rights to the soil beneath their property, not the government. Thus, property owners can collect significant royalties by leasing out their rights. The geographic footprint of the new shale formations that were discovered roughly mirrored the areas that were found to have significant shale gas formations all that was needed was additional infrastructure, including pipelines, gathering systems, fractionation facilities. The US equity structure with MLPs (master limited partnerships) provided a ready vehicle for the rapid capital generation and efficient allocation
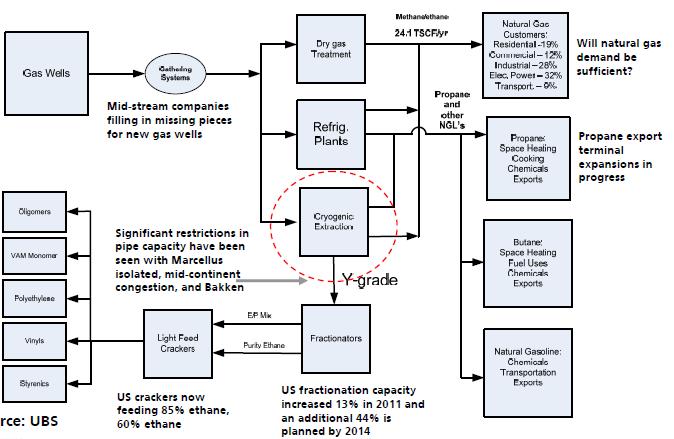
10 Shale Gas Infrastructure 10
11 Shale Gas Production by Formation MM SCF/d E Bakken ,171 Eagle Ford 1,646 1,662 1,616 1,863 2,713 3,955 5,235 6,197 Haynesville 3,781 4,254 5,044 7,207 9,840 9,776 7,675 6,839 Marcellus 1,222 1,390 1,600 2,531 4,793 7,693 11,514 14, Niobrara 3,691 4,414 4,710 4,856 4,762 4,661 4,375 4,316 Permian 4,766 4,758 4,631 4,404 4,244 4,430 4,864 5,431 Utica ,043 Total (wet production) 15,459 16,859 17,999 21,322 26,944 31,412 35,055 39,316 Dry production from Shale 12,653 13,799 14,731 17,452 22,052 25,710 28,691 32,179 US dry gas production 54,613 56,258 55,387 60,548 65,548 66,065 67,484 69,733 Percent from Shale 23.2% 24.5% 26.6% 28.8% 33.6% 38.9% 42.5% 46.1% Source: EIA


12 Natural Gas Production from Shale Formations 12 Dry gas from shale formations comprise nearly half of US gas demand Marcellus region has seen strong growth since the start-up of infrastructure projects Over 1,000 wells in Marcellus region yet to be put into production Source: EIA
13 Marcellus Formation 13 This formation is the largest in the 48 state region with proven reserves of 43 TCF, about 1/3 of US total It is located in SW Pennsylvania and in West Virginia, overlaying traditional oil/gas production areas Production in September was 16 Bcfd or about 20% of US total By 2020, the EIA projects that this formation produce half of the natural gas consumed east of the Mississippi river Access to potentially huge markets on the East Coast await infrastructure developments. Heating is currently based on oil. With the start-up of the ATEX ethane pipeline in 2013, the formerly isolated region is now able to supply ethane to the USGC petrochemical industry 1,300 wells are awaiting infrastructure tie-ins Since 2007, growth in natural gas production has been 42%/yr Shell is looking to site a cracker in Monica, PA Ascend polymers recently licensed PE technology
14 Marcellus Productivity 14 Despite a 21% decline from 2012 to 2013 in the total rig count in the Marcellus, natural gas output per rig rose by 47% according to the DPR. Production gains have come largely from northeastern portions of the basin producing drier natural gas, where output has benefitted from gathering line and pipeline capacity expansions. However, infrastructure improvements have also bolstered production in the wetter southwestern portions of the basin, which saw increased drilling in Source: EIA
15 Shale Gas Well Productivity 1,000 SCF/d per well 8,000 7,000 Marcellus 15 6,000 5,000 4,000 3,000 2,000 1,000 Haynesville Total Utica Eagle Ford E Source: EIA Productivity Report


16 Shale Gas Production Footprint is Small Drilling Wellhead 16 Fracking Completed Well Source: University of Pennsylvania study, June 24, 2009
17 Opposition to Fracking 17 There are geographic and organizational pockets of opposition to shale gas development Primary concerns voiced by the opposition are in the areas of potential ground water contamination and geological activity There are bans on fracking in New York State and in some areas of California Fundamentally, the formations being fracked are significantly deeper than ground water deposits. The instances that have seen leaking wells and contamination of groundwater have been traced to poor cementing and well completions The industry generally supports establishing and enforcement of performance standards for fracking Fracking has resulted in low-level seismic events that have been measured; however, their relationship to other events seen in geologically-sensitive areas is being debated.
18 The Elephant and the Blind Men Once upon a time there was a group of blind men who was joined by a newcomer that had heard of, but never seen an elephant. He asked the men if they could describe an elephant, so that he might recognize the animal if he came across one. 18 The first blind man said, an elephant is like four sturdy trees, and is very tall. The second blind man said, no, an elephant is long and flexible like a snake. The third blind man said, no an elephant is long, curved, and is very hard and smooth and has a pointed end. Shale gas benefit depends on one s position in the value chain.
19 Shale Gas Value Chain Land owners Government US Industry Coal Industry Dry Gas Wells C-1 Chemistry (Ammonia/Methanol) Non-integrated C2 Derivatives First Shale Gas Wells Midstream Companies Ethylene Crackers Integrated Ethylene Derivatives 19 Later Gas Producers Material Providers Engineering Companies Shipping Companies PE Converters Local Employment Energy Consumers Equipment Providers Color key: Positive Neutral Negative
20 Shale Gas Risks 20 Company Write-downs The shale gas mania in 2010/2011 resulted in significant investments. Due to financial accounting rules, recent prices have prompted write-downs of assets Valuation of assets is dependent on long-term pricing forecasts for natural gas and natural gas liquids Some land investments were made with minimal test wells and subsequent wells have proven to have lower hydrocarbon deposits or have been more costly to bring into production ExxonMobil bought XTO energy for $31B in 2010 Mineral rights leases often require a specific timetable for drilling or the right to drill lapses Company Amount Date Comments BP $520M May-14 Utica Shale; poor drilling results Sasol $492M Mar-14 Canadian Shale Itochu/Osaka Gas $290M Mar-14 Shell $2.1B Aug-13 Low gas prices and lower productivity; Eagleford assets put up for sale BHP $2.8B Oct-14 Devon Energy $896M Feb-14 Sumitomo $1.55B B Yen Encana $1.7B Jul-12 BG Group $1.4B Aug-12 Long term gas price of $4.50/MM, down from $5.00 Noble Energy $73M 2Q12 Risks are asymmetric Although the high productivity of shale gas production bring value to the production chain, some areas of the shale gas value chain are prone to more risk than others The abundant supply of natural gas relative to demand resulted in low prices in 2010 and the shut-in of dry gas wells At one time, the NGL uplift of shale gas profitability could completely offset costs; however, sagging prices for ethane, propane and others reduced profitability The oil majors got into shale gas later than fleet-footed midsize companies Total $10.9B
21 21 Ethane Price Relative to Crude and Natural Gas Henry Hub Brent Crude Ethane Dollars per MM BTU Jan07 Apr July Oct Jan08 Apr July Oct Jan09 Apr July Oct Jan10 Apr July Oct Jan Apr July Oct Jan12 Apr July Oct Jan13 Apr July Oct Jan14 Apr July Source: EIA
22 Near-term U.S. Ethylene Industry Response In 2008, the US chemical industry is given a huge opportunity 22 In late 2008, the price of ethylene in the US fell from $0.95 per gallon to $0.40 per gallon in the space of three months and further dropped to $0.25 per gallon in late 2012 The root cause was a glut of ethane on the market that could not be shipped and whose only alternative was to reject into natural gas The sudden shift in the industry cost structure provided incentive to maximize rates, shift to lighter feedstock slates and look at debottlenecking options Several feedstock flexibility projects and minor expansion projects were initiated New capacity Flexability Company County Location Type k MTPA M Lbs/yr M Lbs/yr Start-up k bbl/d ethane Cumulative Eastman Chemical US Longview, Tx R ChevronPhillips US Sweeny, Tx E LyondellBasell US Channelview, TX E Dow Chemical US St.Charles, LA R Q BASF (feedstock flexibility) US Port Arthur E Westlake Chemical - Petro #2 US Lake Charles, LA E Q Dow Chemical US Plaquemine E ,000 2Q Nova Chemical Alberta rate recovery US Joffre, Alberta G LyondellBasell US Clinton, Iowa E Williams US Geismar, LA E H Undisclosed Misc Near Term Totals 1,119 2,
23 Longer-term US Ethylene Industry Response Beginning in 2016, as many as 11 new crackers will start up. A wave of new US-based cracker announcements has been seen Several projects are board approved and have received construction permits Construction has started on three ethylene projects Environmental approvals are being granted without extensive delay Additional debottlenecking and feedstock conversions seen in 2014 and 2015 There are 5 additional projects that are being considered 23 New capacity Flexability Company County Location Type k MTPA M Lbs/yr M Lbs/yr Start-up k bbl/d ethane Cumulative Nova Chemical (feedstock flexibility) Canada Corunna, Ontario F 0 0 1,452 1Q LyondellBasell US LaPorte, Tx E Q Ineos US Choc.Bayou, Tx E Westlake Chemical - Petro #1 US Lake Charles, LA E Q Westlake Chemical US Calvert City, KY E Q LyondellBasell US Channelview E Q LyondellBasell US Corpus Christi E Q LyondellBasell US Channelview II E Q ChevronPhillips US Cedar Bayou G 1,500 3,300 2H Exxon US USGC G 1,500 3,300 3Q Dow Chemical US USGC G 1,500 3, Formosa #3 US Pt.Comfort, Tx E 1,600 3, Axiall/Lotte US Louisiana G 1,000 2, Ascent/Odebrecht (Braskem) US Appalachia G 1,000 2, MexiChem/Occidental US Ingleside,Texas G 544 1, Nova Chemical (expansion) US Corunna, Ontario G Shell US Monaca, Penn. G 1,450 3, Sasol US USGC G 1,500 3, Shintec US USGC G 500 1, Longer Term Totals 14,562 32,037 1,893 1,139
24 US Ethane Exports View of US Ethane Export Plans 24 Company Sourcing Port Crackers Country k bbl/d ethane S/U Timing Ineos Mark West Mariner Marcus Hook, PA Rafnes Norway H15 Ineos Mark West Mariner Marcus Hook, PA Grangemouth UK 23.5 Borealis Sunoco Logistics Marcus Hook, PA Stenungsund Sweden Q16 Reliance Enterprise? Houston Hazira India Q17 Nagothane India Baroda India Dahej India Jamnegar India Total Sabic Enterprise? Houston Wilton UK Unknown Enterprise? 37.1 N/A Total 199 Source: Company announcements and estimates Notes: There are two announced US export terminals that will ship ethane. The Sunoco terminal in Marcus Hook, PA will have the capacity of 70,000 barrels per day when it comes on line in early The Enterprise terminal, located in Houston, Texas will have a capacity of 200,000 barrels per day and is scheduled to come on-line in 2016.
25 Will there be enough Ethane in 2020? Base Case Natural Gas Bridge Natural Gas Bscf/d Comments 2013 production 67.4 Gas demand growth 6.2 Includes 3.7Bcfd industrial growth Reduced Canadian imports 3.7 Other production 77.5 Production excluding LNG exports Delta production Ethane Balance 1,000 Bbl/d 2013 consumption 980 Excludes rejection of 220k Bbls/d 2020 consumption 1,919 Additional requirement 939 Sources of Ethane Gas demand growth (1)(2) 394 Compounded growth rate 1.2% Capture rejected ethane 220 Estimated Export of ethane (230) Potential second terminal Pipelines to Canada (150) Total ethane supply growth 234 Ethane deficit (705) LNG equivalent (Bcfd) 7.4 1) Assumes 7.6Bcfd and 4 GPM liquids, 41% ethane 2) EIA growth forecast is for 2.9Bcfd equivalent to 115,000 Bbl/d
26 US LPG Exports 26 Production of propane, butanes, and natural gasoline has dramatically increased with shale gas Until 2013, US exports were constrained due to undersized export facilities The glut in propane resulted in prices at 60% below international values Several mid-stream companies have recently brought on loading capacity that has relieved pressure on domestic market and softened the arbitrage of international pricing LPG Export Terminal Expansions (million barrels/mo.) Company Location Prior to 2013 By 2016 Total Enterprise - ECHO Houston, TX Targa Galena Park,TX ConnocoPhillips Freeport,TX Sunoco Nederland, TX Kinder Morgan Galena Park, TX Total Natural Gasoline Butanes Propane 1,000 barrels/day Source: EIA
27 US Natural Gas 27 While shale gas is rich in natural gas liquids, the primary product that is produced from these wells is methane The growth in US domestic natural gas demand in the last 30 years has been small, averaging about 1% per year Low gas prices will spur additional use in the power sector, in industry, and in transportation, but will this be enough? The possibility of exports of LNG (liquefied natural gas) will directionally help, but will this be enough for the co-production of NGLs to support the surge of US ethylene capacity expected between 2017 and 2020? Will the opposition to US gas exports succeed in stalling export opportunities? Will the long permitting times for US LNG export projects continue to hamper US access to international markets and provide a competitive disadvantage to Canada, Russia and East Africa?
28 Historic US Natural Gas Demand Bcfd % Growth 1998 to 2013 Residential 0.6% Commercial 0.6% Industrial -0.7% Electric Power 3.9% Transportation 1.2% Total 1.0% Residential Commercial Industrial Electric Power Transportation
29 EIA View: U.S. Natural Gas Outlook 29 Long-term US natural gas domestic demand growth is near 1% per year Short-term demand bumps in 2011/2012 associated with fuel switching coal to gas Production growth highly dependent of LNG exports Transportation Forecast US Natural Gas Demand Growth (Bcfd) Residential 5.9 (8%) Electric Power 13.5 (19%) 22.3 (31%) 9.0 (13%) Commercial 20.4 (29%) Area E delta Growth/yr Residential % Commercial % Industrial % Power % Transport & pipeline % Total Consumption % Source: US Energy Information Administration, Annual Energy Outlook 2014 US Natural Gas Demand, 2013 (Bcfd) Source: EIA Industrial

30 U.S. shale gas leads total gas production U.S. dry natural gas production trillion cubic feet History 2012 Projections billion cubic feet per day 30 Non-associated onshore Non-associated offshore Shale gas Tight gas Associated with oil Coalbed methane Alaska Source: EIA, Annual Energy Outlook 2014 Reference case IAEE International Conference June 16,
31 US C1 Chemical Renaissance 31 A new wave of C1 chemistry projects has emerged in the US based on the belief that natural gas prices will have a significant cost structure advantage over the long term Just within the last 12 months, multiple announcements have resulted in major consultants doubling their projections for capacity additions The two major C1 chemistry chemicals are methanol and ammonia Methanol additions of up to 20 million tonnes would provide more than half of global growth requirements by 2020; associated natural gas feed of 1.9Bcfd would result in additional 75,000 barrels per day of ethane Ammonia additions of 6 million metric tonnes per year would consume 0.65 Bcfd natural gas and provide 25,000 barrels per day of ethane
32 US Ammonia Plant Expansions Within the last 12 months, significant ammonia projects. Several re-starts and debottlenecks Three grassroots ammonia plants moving forward Six additional plants possible 8 million tonnes of new capacity possible 32 Capacity Company Location k MTPA k STPA Start-up NG Use (BCF/d) NG Use (BCF/y) OCI Beaumont, TX Potash Corp Geismar, LA CF Industries Donaldsonville, LA Mosaic Faustina, LA likely H OCI Weaver, Iowa 1,900 2, CF Industries Misc. locations Agrium Redwater Area Incitec Pivot, Ltd Waggaman, LA Agrium Borger, OK Dakota Gasification Co. Beulah, ND ND Corn Growers Spiritwood, ND NA Ohio Valley Resources Spencer Co., IN NA Summit Power Penwell, TX NA Agritos Pasadena, TX TBD NA NA NA NA Agrium US corn belt 1,800 1,980 NA CHS Co-op. Spiritwood, ND H Total US 6,068 6,
33 US Methanol Plant Expansions As much as 30 million tonnes of new capacity for US. 33 Similar to US ethylene, some idled plants have been re-started Leading global producer Methanex is re-locating two Chilean plants to US US producer Celanese building new plant at site where old one was torn down Several Chinese companies currently negotiating for site selection; strategy is to export methanol for use in MTO (ethylene/propylene) production Massive plant possible in Texas City, $4.5B and 7.2M tonnes 10% of global capacity Long-term gas prices of $4-5/MM BTU provide significant economics Capacity Company Location k MTPA M gals/yr Startup NG Use (BCF/d) NG Use (BCF/y) Methanex - Restart Medicine Hat, Alberta, Canada OCI - Restart Beaumont, TX 1, LyondellBasell - Restart Channelview, TX Methanex Geismar (moved from Chile) 1, Celanese Clear Lake, TX 1, Lake Charles Clean Energy Lake Charles, LA 1, Methanex Geismar (moved from Chile) 1, S.Louisiana Methanol Port of S.Lousiana 1, G2X Energy Pampa, TX Yuhuang Chemical - I St.James Parrish 1, Valero Norco, LA 1, Chinese company Texas City 7,200 2, OCI - grassroots Beaumont, TX 1, Yuhuang Chemical - II St.James Parrish 1, Total possible 19,309 7, Probable 10,000 5,
34 US LNG Summary 34 US LNG Project Summary The US has plenty of NGL facilities, the problem is that they were built for imports, not exports! Re-purposing facilities saves some capital, but is not cheap! A liquefaction train is typically $4B with capacity of Bcfd 17 terminals have submitted FERC applications with 26.4Bcfd capacity We believe likely capacity of 12.5Bcfd will be seen by 2020 Cheniere Energy is in the lead with the Sabine Pass project starting up in 2016 and a Corpus Christi terminal being planned US LNG Regulatory Environment The approval process in the US has been quite extensive with three review phases The DOE review is followed by a FERC (Federal Energy Regulatory Commission) review Cove Point, MD FERC environmental review was 20 months The Freeport LNG facility in Lake Charles was initiated in 2010, approved in 2013 Canadian approvals much easier New process introduced in May for non-free trade countries There is significant opposition to US exports in preference for lower domestic prices Dow Chemical advises a cautious approach US LNG Facilities (Bcfd) In Operation In Construction In Engineering Liquefaction (export) Gasification (import)
35 U.S. LNG Projects 35 US LNG Projects in the FERC Approval Pipeline Company Name Location Capacity S/U timing Cheniere Sabine Pass Sabine, TX 1.0Bcfd 2016 Cheniere Sabine Pass Sabine, TX 2.0Bcfd 2017 Cheniere Sabine Pass Sabine, TX 3.2Bcfd 3Q18 Freeport LNG Dev'l Freeport Freeport, TX 2.0Bcfd 2018 Cheniere Corpus Christi Corpus Christi, TX 1.8Bscfd 2019 Trunkline/BG Group Lake Charles Liq. Lake Charles, LA 0.8Bcfd 2H19 Sempra-Cameron LNG Hackberry, LA Hackberry, LA 1.7Bcf 2018 Total 12.5Bcfd Southern Union BG LNG Lake Charles, LA 2.4Bscfd Dominion Cove Point Cove Point, MD 0.82Bcfd 2017 Jordan Cove Coos Bay Coos Bay, OR 1.0Bcfd Oregon LNG Astoria Astoria, OR 1.25Bcfd Excelerate Liquefaction Lavaca Bay, TX Port Lavaca, TX 1.38Bcfd Southern LNG Co. Elba Island, GA Elba Island, GA 0.35Bcfd Magnolia LNG Lake Charles, LA Lake Charles, LA 1.2Bcfd 2018 CE FLNG Plaquemine, LA Plaquemine, LA 1.5Bcfd Exxon Mobil Golden Pass Sabine Pass, TX 2.5Bcfd Gulf LNG Liquefaction Pascagoula, MS Pascagoula, MS 1.5Bcfd Total 26.4Bcfd Other Identified Sites Company Name Location Capacity Gulf Coast LNG Export Brownsville, TX Brownsville, TX 2.8Bcfd Waller LNG Services Cameron Parish, LA Cameron Parish, LA 0.16Bcfd Pangea LNG Ingleside, TX Ingleside, TX 1.09Bcfd Gasfin Development Cameron Parish, LA Cameron Parish, LA 0.2Bcfd Venture Global Cameron Parish, LA Cameron Parish, LA 0.67Bcfd Total 4.9Bcfd Above the 7.4Bcfd requirement for ethane production
 (CP13-483) 3. Lake Charles, LA: 2.2 Bcfd (Southern Union - Trunkline LNG) (CP14-120) 4. Cove Point, MD: 0.82 Bcfd (Dominion Cove Point LNG) (CP13-113) 5.")
36 Proposed LNG Export Terminals 36 Source: EIA Proposed Export Terminals 1. Corpus Christi, TX: 2.1 Bcfd (Cheniere Corpus Christi LNG) (CP12-507) 2. Coos Bay, OR: 0.9 Bcfd (Jordan Cove Energy Project) (CP13-483) 3. Lake Charles, LA: 2.2 Bcfd (Southern Union - Trunkline LNG) (CP14-120) 4. Cove Point, MD: 0.82 Bcfd (Dominion Cove Point LNG) (CP13-113) 5. Astoria, OR: 1.25 Bcfd (Oregon LNG) (CP09-6) 6. Lavaca Bay, TX: 1.38 Bcfd (Excelerate Liquefaction) (CP14-71 & 72) 7. Elba Island, GA: 0.35 Bcfd (Southern LNG Company) (CP14-103) 8. Sabine Pass, LA: 1.40 Bcfd (Sabine Pass Liquefaction) (CP13-552) 9. Lake Charles, LA: 1.07 Bcfd (Magnolia LNG) (CP14-347) 10. Plaquemines Parish, LA: 1.07 Bcfd (CE FLNG) (PF13-11) 11. Sabine Pass, TX: 2.1 Bcfd (ExxonMobil Golden Pass) (CP14-517) 12. Pascagoula, MS: 1.5 Bcfd (Gulf LNG Liquefaction) (PF13-4) 13. Plaquemines Parish, LA: 0.30 Bcfd (Louisiana LNG) (PF14-17) 14. Robbinston, ME: 0.45 Bcfd (Kestrel Energy - Downeast LNG) (PF14-19) PROPOSED CANADIAN SITES 15. Kitimat, BC: 1.28 Bcfd (Apache Canada Ltd.) 16. Douglas Island, BC: 0.23 Bcfd (BC LNG Export Cooperative) 17. Kitimat, BC: 3.23 Bcfd (LNG Canada)
37 Global LNG Trends 37 International natural gas prices are 3X to 4X US prices The BP Group forecasts global LNG demand growth at 15Bscfd by 2020 or 5.5% per year LNG trade is increasingly global with 10% growing to about 25% of gas demand supplied by imports in exporting countries and 27 importing countries Buyers no longer want to be linked to oil but to local gas prices Post-Fukishima energy policies in Japan are being reset China National Petroleum signed a 30-year agreement with Gazprom for 3.6Bcfd via pipeline beginning in 2019 BP Group expects LNG trade to grow by 15Bscfd by 2020, at a CAGR of 5.5% Globally, there are LNG projects representing 60Bscfd of potential export capacity being considered
38 Conclusions 38 Low costs and high and improving productivity of natural gas from shale gas in the US have provided a platform for the renaissance of the US petrochemical industry According to IHS, $1.9 trillion of new capital will be spent on chemical projects and NGL infrastructure by 2035 A total of 1.6 million new jobs will be generated Shale gas is rich in NGLs and the current abundance of ethane has led to low prices and a production significant cost advantage for US ethylene producers The prospect of long-term low natural gas prices in the US has resulted in a surge of interest in ammonia and methanol projects With low domestic demand growth of natural gas, it appears that LNG exports will be required to generate sufficient feedstock for the proposed ethylene crackers It appears that sufficient LNG projects will be executed to meet incremental ethane requirements by 2020; however, a tighter supply/demand balance will likely increase ethane prices

39 Discussion 39 Over Two Decades of Business Research Excellence!
Shale Gas as an Alternative Petrochemical Feedstock
 Shale Gas as an Alternative Petrochemical Feedstock Tecnon OrbiChem Seminar at KICHEM 2012 Seoul - 2 November, 2012 Roger Lee SHALE GAS WHERE DOES IT COME FROM? Source: EIA SHALE GAS EXPLOITATION Commercial
North American LNG Import Terminals Existing
 North American LNG Import Terminals Existing N G D F J H K C B A L I E U.S. A. Everett, MA : 1.035 Bcfd (GDF SUEZ - DOMAC) B. Cove Point, MD : 1.8 Bcfd (Dominion - Cove Point LNG) C. Elba Island, GA :
Natural Gas. Dr. Fred Beach Energy Institute The University of Texas at Austin. Infrastructure as Momentum. Dr. Fred C. Beach.
 Infrastructure as Momentum Dr. Fred Beach Energy Institute The University of Texas at Austin 1 Fossil Fuels Supply 87% of All Energy Consumption in the World 2 Global Consumption Trends 2011 Energy Consumption,
Natural Gas Opportunities
 Natural Gas Opportunities NAFTANEXT Summit Chicago, IL Erica Bowman, Chief Economist April 25, 2014 U.S. Natural Gas Reserves Source: Potential Gas Committee Abundant Supply Estimates of U.S. Recoverable
Winter U.S. Natural Gas Production and Supply Outlook
 Winter 2012-13 U.S. Natural Gas Production and Supply Outlook Prepared for Natural Gas Supply Association by: ICF International Fairfax, Virginia September, 2012 Introduction This report presents ICF s
LNG Exports: A Brief Introduction
 LNG Exports: A Brief Introduction Natural gas one of the world s most useful substances is burned to heat homes and run highly-efficient electrical powerplants. It is used as a feedstock in the manufacture
Global Energy Assessment: Shale Gas and Oil
 Global Energy Assessment: Shale Gas and Oil KEEI September, 2014 Yonghun Jung Shale Gas: a new source of energy Shale gas deposits around the world vs. 2009 natural gas consumption (tcf) U.S. 862 22.8
Bob Horton, March Houston User s Group Customer Meeting, 2013
 Bob Horton, March 2014 Houston User s Group Customer Meeting, 2013 Service in ABB CEO message The Gulf Coast is on fire!! 78 of 97 announced Chem projects in the GC 60B+ to be spent over next 6 years on
AIChE: Natural Gas Utilization Workshop Overcoming Hurdles of Technology Implementation
 AIChE: Natural Gas Utilization Workshop Overcoming Hurdles of Technology Implementation Natural Gas in the United States: An Overview of Resources and Factors Affecting the Market November 2, 216 Justin
Natural Gas Issues and Emerging Trends for the Upcoming Winter and Beyond
 Natural Gas Issues and Emerging Trends for the Upcoming Winter and Beyond 2013 NASEO WINTER ENERGY OUTLOOK CONFERENCE November 1, 2013 Kevin Petak Vice President, ICF International Kevin.Petak@icfi.com
Natural Gas The North American market. Trevor Sikorski, September 2014
 Natural Gas The North American market Trevor Sikorski, September 2014 Overview Gas pricing contrasting fortunes Global gas pricing $/mmbtu 20 18 16 14 12 10 8 6 4 Japan India UK US Global gas market: Still
April 9, 2015 The LNG Export Review Process: A Projectby-Project
 April 9, 2015 The LNG Export Review Process: A Projectby-Project Analysis for April What's Happening: Royal Dutch Shell announced a deal yesterday to buy BG Group, a move that will make Shell a major competitor
THE HYDROCARBON PROCESSING INDUSTRY IN A CHANGED GLOBAL ENVIRONMENT
 THE HYDROCARBON PROCESSING INDUSTRY IN A CHANGED GLOBAL ENVIRONMENT Mark Peters Publisher Oil & Gas Financial Journal markp@pennwell.com www.ogfj.com FACTORS SHAPING ENERGY EXPANSION FOR THE NEXT DECADE:
Natural Gas Supply, Demand, and the Prospects for North American LNG Exports
 Natural Gas Supply, Demand, and the Prospects for North American LNG Exports December 3 rd, 2014 Robert D. Stibolt Senior Managing Director Observations on natural gas prices and project returns Price
Shale Gas & Oil: Global Implications for our Energy Future
 Shale Gas & Oil: Global Implications for our Energy Future Dr Basim Faraj Faraj Consultants Pty Ltd Brisbane, Australia Petroleum Exploration Society of Australia (PESA) (Queensland Branch) Hilton Hotel
UNDERSTANDING NATURAL GAS MARKETS. Mohammad Naserifard MSc student of Oil & Gas Economics at PUT Fall 2015
 UNDERSTANDING NATURAL GAS MARKETS Mohammad Naserifard MSc student of Oil & Gas Economics at PUT Fall 2015 Table of Contents 3 Overview Natural Gas is an Important Source of Energy for the United States.
U.S. Natural Gas Markets Where Is It All Going to Go?
 U.S. Natural Gas Markets Where Is It All Going to Go? October 19, 217 Today s Agenda» Current Natural Gas Market Production Shifting gas flows Demand LNG, Power and Mexico Evolving values basis and price»
ENERGY OUTLOOK 2017 FALL/WINTER
 ENERGY OUTLOOK 2017 FALL/WINTER With more than 105 years in the energy industry, BOK Financial is committed to helping you succeed. In this issue of the Energy Outlook, you ll learn more about the current
THE HYDROCARBON PROCESSING INDUSTRY IN A CHANGED GLOBAL ENVIRONMENT
 THE HYDROCARBON PROCESSING INDUSTRY IN A CHANGED GLOBAL ENVIRONMENT Mark Peters Publisher Oil & Gas Financial Journal markp@pennwell.com www.ogfj.com FACTORS SHAPING ENERGY EXPANSION FOR THE NEXT DECADE:
Trends, Issues and Market Changes for Crude Oil and Natural Gas
 Trends, Issues and Market Changes for Crude Oil and Natural Gas East Iberville Community Advisory Panel Meeting Syngenta September 26, 2012 Center for Energy Studies David E. Dismukes, Ph.D. Center for
Summary LNG, an increasingly important energy option in Asia and the rest of the world But challenges remain for LNG to play an expected bigger role S
 Prospect and Challenges in the World and Asian LNG Market LNG Producer Consumer Conference September 19, 2012 The Institute of Energy Economics Japan Ken Koyama 0 Summary LNG, an increasingly important
US LNG Export Growth and the Benefits to Midstream
 US LNG Export Growth and the Benefits to Midstream July 2018 The US is on the brink of adding significant LNG export capacity in 2019 and becoming a sizable player in the global LNG market. In 2017, the
January 30, 2010 National Conference of State Legislatures Savannah, Georgia. Christopher B. McGill Managing Director, Policy Analysis
 January 30, 2010 National Conference of State Legislatures Savannah, Georgia Christopher B. McGill Managing Director, Policy Analysis U.S. Natural Gas Supply and Infrastructure Additions Points of Discussion
The Really Big Game Changer: Crude Oil Production from Shale Resources and the Tuscaloosa Marine Shale
 The Really Big Game Changer: Crude Oil Production from Shale Resources and the Tuscaloosa Marine Shale Baton Rouge Chamber of Commerce Regional Stakeholders Breakfast June 27, 2012 Center for Energy Studies
North American Midstream Infrastructure Through 2035 A Secure Energy Future. Press Briefing June 28, 2011
 North American Midstream Infrastructure Through 2035 A Secure Energy Future Press Briefing June 28, 2011 Disclaimer This presentation presents views of ICF International and the INGAA Foundation. The presentation
North America Midstream Infrastructure through 2035: Capitalizing on Our Energy Abundance
 North America Midstream Infrastructure through 2035: Capitalizing on Our Energy Abundance Prepared by ICF International for The INGAA Foundation, Inc. Support provided by America s Natural Gas Alliance
The impact of US LNG on European gas prices
 January 2018 The impact of US LNG on European gas prices Increasing US exports of LNG will change how gas prices are determined in Europe Import dependency for the European Union, pushed higher as a result
An Overview of U.S. Liquefied Natural Gas Exports
 Executive Brief An Overview of U.S. Liquefied Natural Gas Exports Executive Summary The world is competing for the tremendous advantage offered by affordable U.S. natural gas. Relative to globally expensive
World and U.S. Oil and Gas Production and Price Outlook: To Infinity (or at least 2050) and Beyond
 and Beyond") World and U.S. Oil and Gas Production and Price Outlook: To Infinity (or at least 25) and Beyond Energy and Environment Symposium April 18, 218 Rifle, Colorado by Troy Cook, Senior Global Upstream Analyst,
World and U.S. Oil and Gas Production and Price Outlook: To Infinity (or at least 25) and Beyond Energy and Environment Symposium April 18, 218 Rifle, Colorado by Troy Cook, Senior Global Upstream Analyst,
Developments in North American Oil, Gas, and LNG
 Developments in North American Oil, Gas, and LNG Presented to the Australian Institute of Energy September 29, 2015 David L. Wochner, Partner, Washington, DC Copyright 2015 by K&L Gates LLP. All rights
U.S. Crude Oil and Natural Gas Proved Reserves, Year-end 2015
 U.S. Crude Oil and Natural Gas Proved Reserves, Year-end 2015 December 2016 Independent Statistics & Analysis www.eia.gov U.S. Department of Energy Washington, DC 20585 This report was prepared by the
Gas and Crude Oil Production Outlook
 Gas and Crude Oil Production Outlook COQA/CCQTA Joint meeting October 3-31, 214 San Francisco, California By John Powell Office of Petroleum, Natural Gas, and Biofuels Analysis U.S. Energy Information
Rice Global E&C Forum
 Rice Global E&C Forum "Will Shale revolution trigger game changes in Asian Energy Market and LNG?" Tevin Vongvanich President and Chief Executive Officer PTT Exploration and Production Public Company Limited
North America s Natural Gas Crisis: The Big Picture Overview and the Role of Unconventional Gas
 North America s Natural Gas Crisis: The Big Picture Overview and the Role of Unconventional Gas Canadian Institute s 3 rd Annual Coalbed Methane Conference June 21, 24 J. David Hughes Geological Survey
US petrochemical renaissance: Hype vs. Reality. Samantha Hartke, Product Manager PetroChem Wire
 US petrochemical renaissance: Hype vs. Reality Samantha Hartke, Product Manager PetroChem Wire Agenda PetroChem Wire: Who we are Ethylene & propylene: The Alphabet Soup of petrochemicals Build, baby, build!
Natural Gas Abundance: The Development of Shale Resource in North America
 Natural Gas Abundance: The Development of Shale Resource in North America EBA Brown Bag Luncheon Bracewell & Giuliani Washington, D.C. February 6, 2013 Bruce B. Henning Vice President, Energy Regulatory
LNG strategy and the outlook for global gas markets
 LNG strategy and the outlook for global gas markets October 16 th, 2012 Jean-Marie Dauger Executive Vice-president GDF SUEZ The LNG market Strong growth particularly in Asia An LNG market of ~550 Mt in
Global energy markets
 For Woodrow Wilson Center Global Energy Forum September 21, 215 Washington, DC by Adam Sieminski, Administrator U.S. Energy Information Administration U.S. Energy Information Administration Independent
MEMORANDUM. May 6, Subcommittee on Energy and Power Democratic Members and Staff
 FRED UPTON, MICHIGAN CHAIRMAN HENRY A. WAXMAN, CALIFORNIA RANKING MEMBER ONE HUNDRED THIRTEENTH CONGRESS Congress of the United States House of Representatives COMMITTEE ON ENERGY AND COMMERCE 2125 RAYBURN
Energy and commodity price benchmarking and market insights
 Energy and commodity price benchmarking and market insights London, Houston, Washington, New York, Portland, Calgary, Santiago, Bogota, Rio de Janeiro, Singapore, Beijing, Tokyo, Sydney, Dubai, Moscow,
Oil and natural gas: market outlook and drivers
 Oil and natural gas: market outlook and drivers for American Foundry Society May 18, 216 Washington, DC by Howard Gruenspecht, Deputy Administrator U.S. Energy Information Administration Independent Statistics
Gulf Coast Energy Outlook: Addendum.
 Gulf Coast Energy Outlook: Addendum. Addendum accompanying whitepaper. See full whitepaper here. David E. Dismukes, Ph.D. Gregory B. Upton, Jr., Ph.D. Center for Energy Studies Louisiana State University
U.S. Shale Gas in Context
 U.S. Shale Gas in Context Overview of U.S. Natural Gas production and trends For National Conference of State Legislatures Natural Gas Policy Institute September 9, 215 Pittsburgh, Pennsylvania By Grant
Al Garcia Business Manager-Americas C4U Trade USA, Inc.
 Revealing Global Trade Flows For Propane And Implications For Supply- Future export markets for North American propane and what this means for PDH feedstock security Al Garcia Business Manager-Americas
Status and outlook for shale gas and tight oil development in the U.S.
 Status and outlook for shale gas and tight oil development in the U.S. for Energy Symposium, University of Oklahoma, Price College Energy Institute Norman, OK by Adam Sieminski, Administrator U.S. Energy
Shale Gas Report Ed 1, 2011
 Market Intelligence Shale Gas Report Ed 1, 2011 Shale gas has been a game changer in the US changing the country from being reliant on imports for the foreseeable future to being able to meet demand from
U.S. Crude Oil, Natural Gas, and NG Liquids Proved Reserves
 1 of 5 3/14/2013 11:37 PM U.S. Crude Oil, Natural Gas, and NG Liquids Proved Reserves With Data for Release Date: August 1, 2012 Next Release Date: March 2013 Previous Issues: Year: Summary Proved reserves
CenterPoint Energy Services. Current Market Fundamentals June 27, 2013
 CenterPoint Energy Services Current Market Fundamentals June 27, 2013 CenterPoint Energy is one of the largest combined electric and natural gas delivery companies in the U.S. Asset portfolio CNP Footprint
Winter U.S. Natural Gas Production and Supply Outlook
 Winter 2010-11 U.S. Natural Gas Production and Supply Outlook Prepared for Natural Gas Supply Association by: ICF International Fairfax, Virginia September, 2010 Introduction This report presents ICF s
Shock and Aftershock: A Look at this Last Winter and the Outlook for Future Supply Disruptions
 0 Shock and Aftershock: A Look at this Last Winter and the Outlook for Future Supply Disruptions Prepared for the North Carolina Propane Gas Association September 16, 2014 Presented by: Warren Wilczewski
CERI Commodity Report Natural Gas
 July-August 1 CERI Commodity Report Natural Gas Ethane Availability for Proposed Western Canadian LNG Facilities Dinara Millington In the Canadian context, the main sources of petrochemical feedstock include
The New Superpower : Emerging Supplies of Gas Liquids from the United States
 The New Superpower : Emerging Supplies of Gas Liquids from the United States Lucian Pugliaresi President Energy Policy Research Foundation, Inc. Washington, DC Energy Policy Research Foundation, Inc. 1031
U.S. Crude Oil and Natural Gas Proved Reserves, Year-end 2016
 U.S. Crude Oil and Natural Gas Proved Reserves, Year-end 2016 February 2018 Independent Statistics & Analysis www.eia.gov U.S. Department of Energy Washington, DC 20585 This report was prepared by the
ROYAL DUTCH SHELL PLC LEADER IN GLOBAL GAS
 ROYAL DUTCH SHELL PLC LEADER IN GLOBAL GAS DEFINITIONS AND CAUTIONARY NOTE Resources: Our use of the term resources in this announcement includes quantities of oil and gas not yet classified as Securities
U.S. NATURAL GAS INDUSTRY: DYNAMIC AS EVER Supply Changes Demand Changes Infrastructure Changes LNG Exports
 O U.S. NATURAL GAS INDUSTRY: DYNAMIC AS EVER Supply Changes Demand Changes Infrastructure Changes LNG Exports Prepared for EPRI Energy and Climate Change Research Seminar Washington, D.C. May 21, 2013
Background, Issues, and Trends in Underground Hydrocarbon Storage
 Background, Issues, and Trends in Underground Hydrocarbon Storage David E. Dismukes Center for Energy Studies Louisiana State University Environmental Permitting Class January 29, 2009 Description of the
Platts NGLs Conference. September 24, 2013
 Platts NGLs Conference September 24, 2013 Agenda 2013 - Executing the Plan 2014 Responding to Delineation Results 2015 Major Ramp Up 2016 Utica to Reach 50% of Marcellus Wet Conclusions 1 Executing the
The US shale revolution and its economic impact
 The US shale revolution and its economic impact Sylvie Cornot-Gandolphe Groupe Idées, Rueil Malmaison, 16 mars 2015 1 The US shale revolution and its economic impact 1. Shale gas Coal-to-gas switching
June North American LNG Projects and Outlook
 June 2014 North American LNG Projects and Outlook About your presenter: Geoffrey Cann National Director, Oil and Gas, Deloitte Brisbane 25 years with Deloitte Canada, Korea, Japan, China, Hong Kong, Australia,
North American Natural Gas Market Outlook
 North American Natural Gas Market Outlook Energy Trends & Impacts On Gas Infrastructure Prepared For: Gas/Electric Partnership, Conference XVIII Darryl Rogers February 10, 2010 Agenda Introduction to Purvin
U.S. natural gas and LNG exports
 U.S. natural gas and LNG exports For Hudson Institute Washington DC April 6, 216 By Victoria Zaretskaya Office of Petroleum, Natural Gas, and Biofuels Analysis U.S. Energy Information Administration Independent
Oil and gas outlook. For New York Energy Forum October 15, 2015 New York, NY. By Adam Sieminski, Administrator. U.S. Energy Information Administration
 Oil and gas outlook For New York Energy Forum New York, NY By Adam Sieminski, Administrator U.S. Energy Information Administration U.S. Energy Information Administration Independent Statistics & Analysis
CERI Commodity Report Natural Gas
 CERI Commodity Report Natural Gas September 15 The Marcellus Shale Paul Kralovic Advances in horizontal drilling, 3-D seismic technology and hydraulic fracturing (fracking) are opening up new shale gas
Annual Energy Outlook 2018 with projections to 2050
 Annual Energy Outlook 218 with projections to 25 February 218 U.S. Energy Information Administration Office of Energy Analysis U.S. Department of Energy Washington, DC 2585 This publication is on the Web
Major Challenges for Gas: What Can be Expected for Mexico?
 Major Challenges for Gas: What Can be Expected for Mexico? Gas Future Forum, Mexico, April 3, 2014 BEG/CEE UT, 1 Overall Observations Resources Reserves Deliverability Deliverability is key Sweet spot
Platts Natural Gas Storage Conference. January 2012
 Platts Natural Gas Storage Conference January 2012 Changing Storage Landscape Tremendous development and expansion in last 10 years has created excess capacity in the Natural Gas Storage Sector Majority
Natural Gas Market Update
 Natural Gas Market Update John Jicha - MGE Director - Energy Supply and Trading Madison Gas and Electric Company Agenda What a difference ten years can make Low prices Fundamental factors impacting the
Markets and Opportunities. Paul Burgener March 2015
 Markets and Opportunities Paul Burgener March 2015 Disclaimer Copyright BP Energy Company. All rights reserved. Contents of this presentation do not necessarily reflect the Company s views. This presentation
2018 Industry Outlook. Pipeliners Association of Houston
 2018 Industry Outlook Pipeliners Association of Houston Jeff Awalt Executive Editor Pipeline & Gas Journal Pipeline Construction Outlook Key Indicators Positive Trends Regulation Drilling economics Oil
Petrochemical Market Outlook What s in store for 2017?
 Petrochemical Market Outlook What s in store for 2017? Malini Hariharan Head of South Asia Markets ICIS www.icis.com 1 Agenda Pricing & Margin Trends China & India Outlook www.icis.com 2 A strong start.
PetroChem Wire. Building more crackers in Appalachia: Is there a there there?
 PetroChem Wire Building more crackers in Appalachia: Is there a there there? PetroChem Wire Samantha Hartke, Product Manager May 2017 Agenda PetroChem Wire: Who we are The alphabet soup of olefins: Ethylene,
North American Gas: A dynamic environment. Josh McCall BP North American Gas and Power November 16, 2011
 North American Gas: A dynamic environment Josh McCall BP North American Gas and Power November 16, 2011 Disclaimer Copyright BP Energy Company. All rights reserved. Contents of this presentation do not
An INDEPENDENT energy consulting company since 1996 No affiliation with any marketer, broker, agent, utility, pipeline or producer.
 An INDEPENDENT energy consulting company since 1996 No affiliation with any marketer, broker, agent, utility, pipeline or producer. More than two decades of experience in the natural gas and electric industries
The Unconventional Oil and Gas Market Outlook
 The Unconventional Oil and Gas Market Outlook The future of oil sands, shale gas, oil shale and coalbed methane Report Price: $2875 Publication Date: July 2010 E N E R G Y The Unconventional Oil and Gas
NEXUS Gas Transmission
 NEXUS Gas Transmission Bringing New Supplies to Market Ohio Manufacturers Association - October 2012 Agenda Project Introduction Utica and Marcellus Gas Supply Michigan and Ontario Markets Conclusion &
LNG Market through. Serving the Asia Pacific. Jordan Cove LNG. Vern A. Wadey. Vice President
 Serving the Asia Pacific LNG Market through Jordan Cove LNG Vern A. Wadey Vice President Pacific North West Economic Region 25th Annual Summit Big Sky, Montana Monday, July 13, 2015 Veresen Inc.: A strong,
Opportuni)es and Consequences of the US Shale Revolu)on. Eric N. Smith Tulane Energy Ins)tute 7/9/16
es and Consequences of the US Shale Revolu)on. Eric N. Smith Tulane Energy Ins)tute 7/9/16") Opportuni)es and Consequences of the US Shale Revolu)on Eric N. Smith Tulane Energy Ins)tute 7/9/16 The surplus of supply over demand in the first half is currently about 800,000 b/d compared with the
Opportuni)es and Consequences of the US Shale Revolu)on Eric N. Smith Tulane Energy Ins)tute 7/9/16 The surplus of supply over demand in the first half is currently about 800,000 b/d compared with the
Trends in International LNG
 Trends in International LNG Anthony Patten, Partner, Allens Presentation to AMPLA State Conference Fremantle, Western Australia 18 May 2012 Allens is an independent partnership operating in alliance with
What s next for Alaska gas
 What s next for Alaska gas Will markets, competition, politics and federal laws get in the way of a pipeline Larry Persily, Alaska North Slope Gas Line Federal Coordinator Nov. 9, 2012 Commonwealth North
The Impact of Developing Energy and Environmental Policy on the Gas Industry Plus Impacts of the Current Economic State
 The Impact of Developing Energy and Environmental Policy on the Gas Industry Plus Impacts of the Current Economic State Gas / Electric Partnership Conference XVII Gas Compression from Production thru Transmission
Annual Energy Outlook 2017
 Annual Energy Outlook 217 Valve Manufacturers Association of America VMA Technical Seminar 217 March 2, 217 Nashville, TN By, Director, Office of Integrated and International Energy Analysis U.S. Energy
HGAP. Haynesville Global Access Pipeline. Tellurian Midstream Group April 2018
 HGAP Haynesville Global Access Pipeline Tellurian Midstream Group April 2018 Cautionary statements Forward looking statements The information in this presentation includes forward-looking statements within
US LNG Supply into Europe. Baltic Energy Summit, Vilnius November 25 th, 2015 Helena Wisden, Cheniere Marketing International
 US LNG Supply into Europe Baltic Energy Summit, Vilnius November 25 th, 2015 Helena Wisden, Cheniere Marketing International Forward Looking Statements This presentation contains certain statements that
A Tale of Two Fuels - Crude Oil and Natural Gas Supply. Private Capital Conference February 24, 2011 Houston, TX
 A Tale of Two Fuels - Crude Oil and Natural Gas Supply Private Capital Conference February 24, 2011 Houston, TX Henry Hub Natural Gas vs. WTI Crude $/MMBTU $14 $12 $10 $8 $6 $4 $2 Henry Hub WTI 160 140
IHS LATIN AMERICA LPG SEMINAR
 ENTERPRISE PRODUCTS PARTNERS L.P. IHS LATIN AMERICA LPG SEMINAR November 8, 2016 Joseph Fasullo Manager, International NGLs ALL RIGHTS RESERVED. ENTERPRISE PRODUCTS PARTNERS L.P. enterpriseproducts.com
Feedstock & Investment Strategies for Revitalising Europe
 Feedstock & Investment Strategies for Revitalising Europe WPC2017 Tom Crotty INEOS INEOS Background A world scale producer of petrochemicals and polymers Turnover $54bn (2015) 18,600+ employees 105 manufacturing
Acceptance Natural Gas Demand to Stay High on Cold Weather Forecast
 Mar-17 Apr-17 May-17 Jun-17 Jul-17 Aug-17 Sep-17 Oct-17 Nov-17 Dec-17 Jan-18 Feb-18 Mar-18 8: 8:45 9:3 1:15 11: 11:45 12:3 13:15 14: Prior Day s NYMEX Jan-18 Contract (CT) 2.68 2.67 2.66 2.65 2.64 2.63
US Hydrocarbon Exports Presented by
 September 12, 2017 Luncheon US Hydrocarbon Exports Presented by Tom Seng Assistant Professor Crude Oil Prices 2 Oil Prices Over the Past Year 3 Natural Gas Prices 4 Natural Gas Prices Over the Past Year
U.S. Crude Oil and Natural Gas Proved Reserves, 2012
 U.S. Crude Oil and Natural Gas Proved, 2012 April 2014 Independent Statistics & Analysis www.eia.gov U.S. Department of Energy Washington, DC 20585 This report was prepared by the U.S. Energy Information
Drilling Deeper: A Reality Check on U.S. Government Forecasts for a Lasting Tight Oil & Shale Gas Boom. Web Briefing December 9, 2014
 Drilling Deeper: A Reality Check on U.S. Government Forecasts for a Lasting Tight Oil & Shale Gas Boom Web Briefing December 9, 214 J. David Hughes Post Carbon Institute Global Sustainability Research
U.S. Natural Gas and the Potential for LNG Export Growth
 U.S. Natural Gas and the Potential for LNG Export Growth Presentation to: 2018 Wyoming Oil & Gas Fair By: John Harpole September 12, 2018 It is not a scarce resource anymore 2 US RIG COUNTS: Aug 2018
Louisiana Unconventional Natural Gas and Industrial Redevelopment
 Louisiana Unconventional Natural Gas and Industrial Redevelopment Risk Management Association Luncheon March 21, 2013 David E. Dismukes, Ph.D. Center for Energy Studies Louisiana State University STUDY
Commonwealth North Jim Harvey June 11, 2010
 Commonwealth North Jim Harvey June 11, 2010 UniversalPegasus International Agenda Overview of UniversalPegasus What we do Gas Supply in US Pipeline Perspective Storage Projects UPI Experience GIS systems
Pricing, markets and investments. SPM 9541 December 2010 Aad Correljé
 Pricing, markets and investments SPM 9541 December 2010 Aad Correljé Programme Visions on gas prices Gasmarkets Market prices? Pricing systems June 29, 2011 2 Dutch gas price to domestic households 10,2%
U.S. Historical and Projected Shale Gas Production
 U.S. Historical and Projected Shale Gas Production Phyllis Martin Phyllis Martin, Senior Energy Analyst Office of Petroleum, Gas and Biofuels Analysis U.S. Energy Information Administration phyllis.martin@eia.doe.gov
SAMPLE. US Shale. Insight Report
 US Shale Insight Report 2013 www.eic-consult.com Contents Page Outlook and Executive Summary 8-15 Shale Operations and Technology 16-24 Shale Economics and International LNG Markets 25-37 Major Shale Plays
Unconventional Oil & Gas: Reshaping Energy Markets
 Unconventional Oil & Gas: Reshaping Energy Markets Guy Caruso Senior Advisor JOGMEC Seminar 7 February 2013 Landscape is Changing Even as We Sit Here Today - US Projected to reach 90% Energy Self-Sufficiency
U.S. Natural Gas and the Poten3al for LNG Export Growth
 U.S. Natural Gas and the Poten3al for LNG Export Growth Presentation to: 2018 Wyoming Oil & Gas Fair By: John Harpole September 12, 2018 It is not a scarce resource anymore 2 US RIG COUNTS: Aug 2018 vs
Brian A. Habacivch Constellation, Commodities Management Group October 20, 2018
 North American Energy Outlook The Transformative Role of Shale in the Global Hydrocarbons Market Why It Matters to Commercial, Institutional, and Industrial End Users Brian A. Habacivch Constellation,
I Saw Miles and Miles of Texas
 A RBN Energy Drill Down Report Copyright 2016 RBN Energy I Saw Miles and Miles of Texas Mexican Demand, LNG Exports Pull Marcellus/Utica Gas to Lone Star State Favorable production economics will drive