Hydrologic Measurements in the Sierra Nevada: SNAMP and Beyond. Sarah Martin Graduate Student Researcher University of California, Merced
|
|
|
- Solomon Casey
- 6 years ago
- Views:
Transcription


1 Hydrologic Measurements in the Sierra Nevada: SNAMP and Beyond Sarah Martin Graduate Student Researcher University of California, Merced
2 Overview Science directions and questions What do we expect to see? Infrastructure and data collection What are we collecting and how are we collecting it? Research Highlights What is the data showing? What can we learn from it? Future plans What are our next steps? Expanded view How does SNAMP fit into the broader picture? What similar studies are being conducted? Sierra Nevada Adaptive Management Project
3 Research Questions Where and when is water stored and how is it routed through the catchments? What effects do forest treatments have on water quality, quantity, storage and routing through the catchments? What is the transferability of 1 km 2 watersheds to fireshed response? Sierra Nevada Adaptive Management Project
4 Hypothesis 1 Fuels treatments will reduce LAI As Leaf Area Index (LAI) decreases, snow accumulation on the ground will increase, while evapotranspiration (ET) and snow retention in late spring will decrease. Sierra Nevada Adaptive Management Project
5 What is LAI? Leaf Area Index the ratio of total upper leaf surface of vegetation divided by the surface area of the land on which the vegetation grows the one sided green leaf area per unit ground area the amount of leaf material in an ecosystem LAI ~ canopy cover TERRESTRIAL-LAI.htm Sierra Nevada Adaptive Management Project
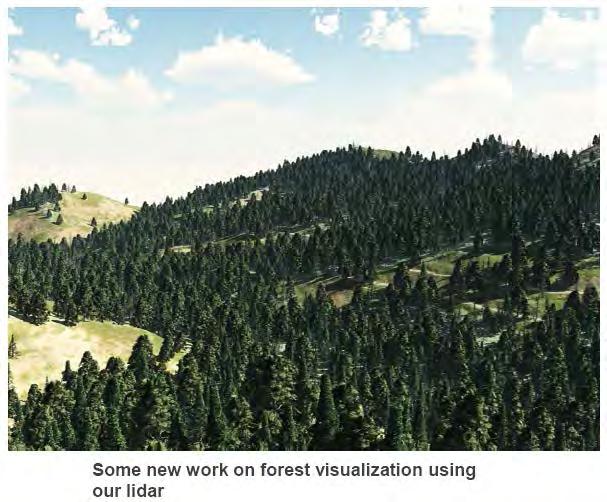
 We have acquired lidar data for both study areas.")
6 How do we measure LAI? An Introduction to Lidar Lidar = Light Detection and Ranging We contracted with the National Center for Airborne Laser Mapping (NCALM) We have acquired lidar data for both study areas. The type of Lidar we used picks up multiple returns giving us canopy structure data Image modified from Lefsky et al with tree graphic from globalforestscience.org.

7
8 Hypothesis 1 Fuels treatments will reduce LAI As Leaf Area Index (LAI) decreases, snow accumulation on the ground will increase, while evapotranspiration (ET) and snow retention in late spring will decrease. Sierra Nevada Adaptive Management Project

9 Fuels treatments lower LAI less interception and more solar radiation Size and spacing of gaps will also control snow accumulation and melt timing
10 Hypotheses 2 A change in snow accumulation will be seen in the magnitude of peak stream flow. Changes in snow retention, will be observed in the recession limb of the hydrograph and the soil moisture curves. Changes in ET will affect both the timing and the magnitude of late season base stream flow.
11 Hypothesis 3 Changes in water chemistry will be a function of changes in discharge. Increased turbidity will be a function of stream discharge as opposed to hillslope erosion. Sierra Nevada Adaptive Management Project
 20 15 10 5 0 P301 P303 P304 D102 Watershed Headcut Erosion Bank Erosion Data from King s River Experimental Watershed In-stream sources")
12 Current Sediment Work Headcut Erosion vs. Bank Erosion 25 Eroded Volume (cu. m) P301 P303 P304 D102 Watershed Headcut Erosion Bank Erosion Data from King s River Experimental Watershed In-stream sources appear to be most significant contribution to sediment budget

13 Hypothesis 4 Using hydrologic models, physiographic and hydroclimatic thresholds can be defined linking area treated with aquatic effects and impacts on forest water cycle. Hydrologic models will allow us to scale up responses to the larger watershed and fireshed levels.
 Outputs (stream flow, evaporation/sublimation, ET) Storage (snowpack, soil moisture) Energy (temp, solar radiation, wind) Physical parameters")
14 What s important? If we want to understand the water cycle, what do we need to measure? Inputs (precipitation) Outputs (stream flow, evaporation/sublimation, ET) Storage (snowpack, soil moisture) Energy (temp, solar radiation, wind) Physical parameters (slope, aspect, elevation, vegetation)


15 Last Chance Sierra Nevada boundary Last Chance Meteorological Station Monitored Watershed Study Area Sugar Pine Sugar Pine
16 Sampling Design BACI design Final Criteria: ~1 km 2 headwater catchments perennial stream reach nested within fireshed of km 2 Similar vegetation, slope, stream length, aspect Near rain-snow transition Sierra Nevada Adaptive Management Project

17 Challenges to measurements Continuous measurements Remote locations Access Power Complex terrain Lots of variability Sierra Nevada Adaptive Management Project

18 Meteorological Stations 4 Stations northern and southern sites lower and higher elevation Open areas on ridge tops Weather measurements Sierra Nevada Adaptive Management Project


19 Meteorological Data Wind speed and direction Air temperature Relative humidity Solar radiation Precipitation For hydrologic modeling Incoming and net radiation affects how fast snow melts and soil dries Ultrasonic depth sensors and tipping bucket gages measure warm and cold season precipitation Barometric pressure For stream flow calculations /ds2manual.pdf

20 Hillslope Instruments Snow depth and soil moisture instrument nodes On north and south facing slopes adjacent to met stations and stream instruments Sensors at multiple depths Sierra Nevada Adaptive Management Project

21 Continuous Water Quality Data Multi-parameter Sonde Temperature Conductivity Optical turbidity Optical dissolved oxygen Stage

22 Water Samples Automated sampler Tied to turbidity to catch storm events Grab samples In-depth lab analysis Quality control for continuous sensors Sierra Nevada Adaptive Management Project


23 Sediment Erosion Pins Turbidity Suspended sediment Scour Pans

24 Discharge The challenge is to measure both peak and base flows in streams with a wide range of discharges and a significant subsurface component Pressure transducers + rating curves Weir/Stilling wells
25 Measurements Met stations Wind speed/direction Air temperature Relative humidity Incoming solar radiation Net solar radiation Precipitation (rain) Snow depth Hill slopes Snow depth Soil moisture Stream stations Stage discharge Water temperature Conductivity Dissolved oxygen Turbidity Automated and manual grab samples Sediment (suspended) Stable isotopes Major cations and anions ph Alkalinity Sediment (bedload) A total of ~270 instruments.. Sierra Nevada Adaptive Management Project
26 Stream Rating Curves y=2762x 2.67 r 2 =0.952 y=373.8x 6.23 r 2 =0.733 y=1033x 2.19 r 2 =0.948 y=8298x 4.15 r 2 =0.991 Data through WY 2010 (from YSI sondes)
27 Discharge Data WY 2010 Sierra Nevada Adaptive Management Project
28 Speckerman Stream Chemistry WY 2010
29 Spring Snowmelt Data Big Sandy Met Snow Storms Cold Front 25 WY 2008 WY 2008 Snow Data 30 Snow Depth (meter) /1/2008 3/8/2008 3/15/2008 3/22/2008 3/29/2008 4/5/2008 4/12/2008 4/19/2008 4/26/2008 5/3/2008 5/10/2008 5/17/2008 5/24/2008 Time (hourly) Temperature (deg C) 25 Snow Storms WY 2009 WY 2009 Snow Data 30 Snow Depth (meter) /1/2009 3/8/2009 3/15/2009 3/22/2009 3/29/2009 4/5/2009 4/12/2009 4/19/2009 4/26/2009 5/3/2009 5/10/2009 5/17/2009 5/24/2009 Time (hourly) Temperature (deg C)
30 Storm-Melt Sequence Fronts Snow Storm Snow? Rain Storm Increase in Depth Turbidity Spike?

31 How do we use this data? We measure at points. How do we get to the landscape scale? Hydrologic Modeling Sierra Nevada Adaptive Management Project


32 Between watersheds Within watershed Modeling context Multi-scale heterogeneity in controlling processes, e.g. snow accumulation & melt is problematic to represent at a regional scale using a strictly empirical approach Christina Tague, UCSB open drip edge Fine scale under canopy


33 Scaling up and modeling change Computer models allow us to better represent heterogeneity across a broad area Slope Aspect Also to change parameters and see effects drought vs. wet years increase in temperature


34 Next steps Final installations Big Sandy wier Culvert weirs Scour pans Automatic water samplers Continued data analysis Modeling Results Calibration Large scale version of drop-box weir at Reynolds Creek Experimental Watershed Bonita and Pierson, 2003
35 Beyond SNAMP Last Chance Tioga Pass Road American River SNAMP sites are part of a larger transect that includes sites throughout the Sierra Sugar Pine KREW - CZO Wolverton

36 Snowpack loss & water storage: 30-yr horizon snowpack annual storage Sacramento Valley storage San Joaquin Valley storage Likely loss of ~3.5 MAF of snowpack storage in next 1-3 decades MAF: million acre feet Data from DWR

37 Influence of +3ºC on Snow vs Rain More rain, less snow Earlier snowmelt More winter floods Historical, 0 to -3 o C The water cycle in California s mountains is undergoing long-term shifts. Bales et al., 2006
38 California has a need for a modern, integrated water information system SNRI researchers are building prototype systems


39 A new generation of integrated measurements eddy correlation embedded sensor networks lidar isotopes & ions satellite snowcover low-cost sensors discharge sap flow sediment
 Wired & Alden radios Retrieval: manual Period: 2009-19 + (Scripps sensors in parens)")


40 Tioga Pass Road Merced Grove km Gin Flat Elevational transect Smokey Quarry Decagon EC-TM: 57 (12) Judd snow depth: 28 Met stations: (4) Wired & Alden radios Retrieval: manual Period: (Scripps sensors in parens) Decagon EC-TM: 214 Decagon MPS: 113 Judd snow depth: 57 Met stations: 2 Wired & Dust Network radios Retrieval: manual & cell phone Period: Providence Creek basin Wolverton basin Long Meadow Panther Meadow km Decagon EC-TM: 8 Campbell CS616: 57 Watermark: 9 Judd snow depth: 26 Met stations: 2 Wired & Crossbow radios Retrieval: manual Period: Southern sierra Critical Zone Observatory m elevation Rain-snow transition zone m, lies in the snow zone

41 Prototype embedded sensor network Packet delivery ration RSSI<- 80dBm RSSI>- 80dBm Received signal strength (RSSI), log scale Randomized channelhopping protocol Self-assembling redundant mesh Near 100% transmission w/ RSSI > -73 dbm, i.e. spacing of < 100 m 2008-present

42 San Joaquin R. Kings R. Fresno Kaweah R.


43 Flux towers along an elevation gradient, m, extend the core CZO instrument cluster from water-limited to temperaturelimited ecosystems 4 towers in place now, 3 more planned under NEON (2 co-located)

44 Water flux based on soil moisture vs. sap flow ET decreasing from 1 to 0.5 mm/d ET decreasing towards 0.1 mm/d Soil moisture & sap flux track each other Jan Hopmans, UCD
45 Increase in water yield w/ elevation, from rain to snow dominated Mean elevations for 8 catchments across the rain-snow transition Climatic, physiographic & vegetation controls on water yield Modeling in progress Decreasing temperature Increasing snow fraction Decreasing LAI Coarser soils C. Hunsaker et al., in preparation


46 Very high annual & summer ET at P301 Air T ( o C) Rnet (W/m 2 ) Cumulative Et (mm) 730 mm Et, 10/08-10/09 Little rain, 5/09-10/09 Sep- 08 Jan 09 Jun 09 Jan mm Et, 5/10-10/10 Jun 10 High summer values depend on deep root extraction of water Happy elev for trees T & precip just right Soils hold snowmelt over summer. How much water can soils hold vs. elev?
47 Where can you find data? California Data Exchange Center Station Codes Big Sandy Met (BSN) Fresno Dome (FRD) Bear Trap (BTP) Duncan Peak (DUN) UC Merced Digital Library SNAMP Digital Library Sierra Nevada Adaptive Management Project

48

49

50
51 Data availability through digital library Level 2 data from core field measurements made available by water year: snow, soil moisture, temperatures Level 1 data available by request Sierra Nevada Adaptive Management Project
 359-6252 Phil Saksa psaksa@ucmerced.edu Sierra Nevada Adaptive Management Project http://snamp.cnr.")
52 Contacts Roger Bales (209) Martha Conklin (209) Patrick Womble Sarah Martin (559) Phil Saksa Sierra Nevada Adaptive Management Project
SNAMP water research. Topics covered
 SNAMP water research SNAMP water team UC Merced Topics covered Objectives, goals & overview What & why the water component of SNAMP Pre-treatment Observations Water Quality Water Quantity Modeling & Scenarios:
2009 SNAMP Public Meeting
 2009 SNAMP Public Meeting October 20 2009 Today s Agenda 10 10:15am Welcome and overview John Battles 10:15 10:30am Implementation update USFS District Rangers 10:30 12:00am UC Science Team updates o Project
Latest Information from DWR on Prop 84
 March 25, 2014 1 Introductions Forest First Workgroup Recap Prop 84 Forest First Project Monitoring Forest First Increased Water Supply Improved Water Quality Reduced Operations and Maintenance Costs Latest
Water Yield in Thinned Stands: Observations from the Sierra Nevada
 Water Yield in Thinned Stands: Observations from the Sierra Nevada Roger Bales, UC Merced Topics in this talk Sierra Nevada hydrology Estimating evapotranspiration Drought impacts Thinning impacts Wildfire
M.L. Kavvas, Z. Q. Chen, M. Anderson, L. Liang, N. Ohara Hydrologic Research Laboratory, Civil and Environmental Engineering, UC Davis
 Assessment of the Restoration Activities on Water Balance and Water Quality at Last Chance Creek Watershed Using Watershed Environmental Hydrology (WEHY) Model M.L. Kavvas, Z. Q. Chen, M. Anderson, L.
Affected Environment and Environmental Consequences. 3-8 Research Introduction Affected Environment
 3-8 Research Affected Environment and Environmental Consequences 3-8.1 Introduction The following section provides information to assess the consequences on the information able to be developed and analyzed
Discharge and Sediment Loads at the Kings River Experimental Forest in the Southern Sierra Nevada of California
 Discharge and Sediment Loads at the Kings River Experimental Forest in the Southern Sierra Nevada of California Sean M. Eagan Carolyn T. Hunsaker Christopher R. Dolanc Marie E. Lynch Chad R. Johnson USDA
Watershed Characterization, Monitoring and Measurements
 Watershed Characterization, Monitoring and Measurements Intent - highlight key approaches to watershed monitoring using the Fair Hill Study watershed as an example Watershed characterization and monitoring
Uncertainty in hydrologic impacts of climate change: A California case study
 Uncertainty in hydrologic impacts of climate change: A California case study Ed Maurer Civil Engineering Dept. Santa Clara University Photos from USGS Motivating Questions What are potential impacts of
Water security in California in the age of drought
 Water security in California in the age of drought Roger Bales, UC Merced Mar 27, 2010 Mar 29, 2015 Jan 26, 2016 https://earthdata.nasa.gov/labs/worldview Sierra Nevada Research Institute Foster interdisciplinary
Position Description Sierra Nevada AmeriCorps Partnership
 SNAP Position Description Position Description Sierra Nevada AmeriCorps Partnership Position Title: Watershed Technician (hydrology, water resources or biology emphasis) Host Site: Fresno Office, Pacific
5.5 Improving Water Use Efficiency of Irrigated Crops in the North China Plain Measurements and Modelling
 183 5.5 Improving Water Use Efficiency of Irrigated Crops in the North China Plain Measurements and Modelling H.X. Wang, L. Zhang, W.R. Dawes, C.M. Liu Abstract High crop productivity in the North China
EFFECTS OF WATERSHED TOPOGRAPHY, SOILS, LAND USE, AND CLIMATE ON BASEFLOW HYDROLOGY IN HUMID REGIONS: A REVIEW
 PROGRESS IN PHYSICAL GEOGRAPHY EFFECTS OF WATERSHED TOPOGRAPHY, SOILS, LAND USE, AND CLIMATE ON BASEFLOW HYDROLOGY IN HUMID REGIONS: A REVIEW KATIE PRICE 2011 Presented by: Jordan Martin Article Overview
Hydrology Review, New paradigms, and Challenges
 Hydrology Review, New paradigms, and Challenges Intent quick introduction with emphasis on aspects related to watershed hydrochemistry and new paradigms Watershed / Catchment Definition Portion of landscape
Vegetation Management and Water Yield: Silver Bullet or a Pipe Dream?
 Vegetation Management and Water Yield: Silver Bullet or a Pipe Dream? Lee H. MacDonald rofessor Emeritus and Senior Research Scientist Watershed Science/NREL Colorado State University, Fort Collins, CO
Working with the Water Balance
 Working with the Water Balance Forest Hydrology and Land Use Change Paul K. Barten, Ph.D. Professor of Forestry and Hydrology Department of Environmental Conservation www.forest-to-faucet.org The Living
Definitions 3/16/2010. GG22A: GEOSPHERE & HYDROSPHERE Hydrology
 GG22A: GEOSPHERE & HYDROSPHERE Hydrology Definitions Streamflow volume of water in a river passing a defined point over a specific time period = VxA discharge m 3 s -1 Runoff excess precipitation - precipitation
Stormwater Runoff Water Quality Characteristics From Highways in Lake Tahoe, California
 California State University, Sacramento (CSUS) University of California, Davis (UCD) California Department of Transportation (Caltrans) Stormwater Runoff Water Quality Characteristics From Highways in
Sustainable Stormwater Management: Validating Water Quality and Quantity
 Sustainable Stormwater Management: Validating Water Quality and Quantity Progress Report from University of Virginia November 12, 2008 UVA Undergraduate Student Participants Andrew T. Smith Civil & Environmental
BAEN 673 / February 18, 2016 Hydrologic Processes
 BAEN 673 / February 18, 2016 Hydrologic Processes Assignment: HW#7 Next class lecture in AEPM 104 Today s topics SWAT exercise #2 The SWAT model review paper Hydrologic processes The Hydrologic Processes
Inside of forest (for example) Research Flow
 Research Flow") Study on Relationship between Watershed Hydrology and Lake Water Environment by the Soil and Water Assessment Tool (SWAT) Shimane University Hiroaki SOMURA Watershed degradation + Global warming Background
Study on Relationship between Watershed Hydrology and Lake Water Environment by the Soil and Water Assessment Tool (SWAT) Shimane University Hiroaki SOMURA Watershed degradation + Global warming Background
Hydrologic Modeling Overview
 Hydrologic Modeling Overview Chuck Downer, PhD, PE Hydrologic Systems Branch Coastal and Hydraulics Laboratory Engineer Research and Development Center Vicksburg, Mississippi Hydrologic processes Hydrologic
Chehalis Basin Strategy Causes of Extreme Flooding. October 11, 2016 Policy Workshop
 Chehalis Basin Strategy Causes of Extreme Flooding October 11, 2016 Policy Workshop Agenda Hydrology o Precipitation o Flow Climate Change Effects Land Use o Channel straightening and incision o Riparian
SSCZO Final Report
 SSCZO Final Report 2007-2013 1 Cover Federal Agency and Organization Element to Which Report is Submitted: 4900 Federal Grant or Other Identifying Number Assigned by Agency: 0725097 Project Title: CZO:
Lecture 9A: Drainage Basins
 GEOG415 Lecture 9A: Drainage Basins 9-1 Drainage basin (watershed, catchment) -Drains surfacewater to a common outlet Drainage divide - how is it defined? Scale effects? - Represents a hydrologic cycle
2
 1 2 3 4 5 6 The program is designed for surface water hydrology simulation. It includes components for representing precipitation, evaporation, and snowmelt; the atmospheric conditions over a watershed.
NREM 407/507 WATERSHED MANAGEMENT Day 2
 NREM 407/507 WATERSHED MANAGEMENT 1-15-09 - Day 2 1. Review Hydrologic Cycle Terminology/Model 2. Summarize Differences Cropfield vs Perennial Watershed 3. Tues Lab Develop International River PPT bring
Appendix L1 Estimated Evaporation from Bristol and Cadiz Dry Lakes
 Appendix L1 Estimated Evaporation from Bristol and Cadiz Dry Lakes TECHNICAL MEMORANDUM Estimated Evaporation From Bristol and Cadiz Dry Lakes PREPARED FOR: Cadiz PREPARED BY: DATE: May 8, 2012 Terry Foreman/CH2M
Hydrologic Modeling with the Distributed-Hydrology- Soils- Vegetation Model (DHSVM)
") Hydrologic Modeling with the Distributed-Hydrology- Soils- Vegetation Model (DHSVM) DHSVM was developed by researchers at the University of Washington and the Pacific Northwest National Lab 200 Simulated
Hydrologic Modeling with the Distributed-Hydrology- Soils- Vegetation Model (DHSVM) DHSVM was developed by researchers at the University of Washington and the Pacific Northwest National Lab 200 Simulated
Culvert Sizing procedures for the 100-Year Peak Flow
 CULVERT SIZING PROCEDURES FOR THE 100-YEAR PEAK FLOW 343 APPENDIX A: Culvert Sizing procedures for the 100-Year Peak Flow A. INTRODUCTION Several methods have been developed for estimating the peak flood
Module 5 Measurement and Processing of Meteorological Data
 Module 5 Measurement and Processing of Meteorological Data 5.1 Evaporation and Evapotranspiration 5.1.1 Measurement of Evaporation 5.1.2 Pan Evaporimeters 5.1.3 Processing of Pan Evaporation Data 5.1.4
From the cornbeltto the north woods; understanding the response of Minnesota. Chris Lenhart Research Assistant Professor BBE Department
 From the cornbeltto the north woods; understanding the response of Minnesota watersheds to climate change Chris Lenhart Research Assistant Professor BBE Department 1. Background Differential response of
The Hydrological Cycle. Hydrological Cycle. Definition of Terms. Soils and Water, Spring Lecture 7, The Hydrological Cycle 1
 The Hydrological Cycle Water vapor helps warm up the earth Evaporation+Transpiration Chemical Spill Runoff To Oceans Water potential, atmosphere Hydrological Cycle Transpiration, T Atmospheric pool Interception
Interest in a Community Model for Operational Delta Forecasting
 NOAA s National Weather Service California-Nevada River Forecast Center Interest in a Community Model for Operational Delta Forecasting Rob Hartman Hydrologist in Charge Mission of NWS Hydrologic Services
Watersheds and the Hydrologic Cycle
 Watersheds and the Hydrologic Cycle The Global Hydrologic Cycle Water Cycle in Florida Florida Water Facts Surface Area = 170,452 km 2 Average Rainfall = 140 cm (55 ) Total Annual Rain = 238 billion m
Measuring discharge. Climatological and hydrological field work
 Measuring discharge Climatological and hydrological field work 1. Background Discharge (or surface runoff Q s) refers to the horizontal water flow occurring at the surface in rivers and streams. It does
Adaptation Strategy of the Slovak Republic on Adverse Impacts of Climate Change Overview: Executive Summary
 Adaptation Strategy of the Slovak Republic on Adverse Impacts of Climate Change Overview: Executive Summary Ministry of Environment of the Slovak Republic December 2016 Climate change has caused a wide
Effect of Land Surface on Runoff Generation
 Effect of Land Surface on Runoff Generation Context: Hydrologic Cycle Runoff vs Infiltration Infiltration: Process by which water on the ground surface enters the soil Runoff: Water (from rain, snowmelt,
Introduction. Welcome to the Belgium Study Abroad Program. Courses:
 Introduction Welcome to the Belgium Study Abroad Program Courses: AGSM 335: Soil and Water Management BAEN 460: Principals of Environmental Hydrology BAEN 460 / AGSM 335 Combined lecture and HW sessions
Monitoring and Data Collection
 Setting the Course for Improved Water Quality Monitoring and Data Collection A TMDL training program for local government leaders and other water resource managers Session 8 wq-iw3-58 Your project to date
Runoff Processes. Daene C. McKinney
 CE 374 K Hydrology Runoff Processes Daene C. McKinney Watershed Watershed Area draining to a stream Streamflow generated by water entering surface channels Affected by Physical, vegetative, and climatic
Hydrologic Pathways: Precipitation, ET, Storage, Runoff & Recharge. Joe Magner, MPCA
 Hydrologic Pathways: Precipitation, ET, Storage, Runoff & Recharge Joe Magner, MPCA Concrete! Sluice gates Channels What was the consequence Loss of 60,000 fishing jobs Initial 20 % loss of lake volume,
CHAPTER FIVE Runoff. Engineering Hydrology (ECIV 4323) Instructors: Dr. Yunes Mogheir Dr. Ramadan Al Khatib. Overland flow interflow
 Instructors: Dr. Yunes Mogheir Dr. Ramadan Al Khatib. Overland flow interflow") Engineering Hydrology (ECIV 4323) CHAPTER FIVE Runoff Instructors: Dr. Yunes Mogheir Dr. Ramadan Al Khatib Overland flow interflow Base flow Saturated overland flow ١ ٢ 5.1 Introduction To Runoff Runoff
Engineering Hydrology (ECIV 4323) CHAPTER FIVE Runoff Instructors: Dr. Yunes Mogheir Dr. Ramadan Al Khatib Overland flow interflow Base flow Saturated overland flow ١ ٢ 5.1 Introduction To Runoff Runoff
Adaptation: Advising Local Governments on Climate Change Vulnerability
 Local Government Commission Building Livable Communities Ahwahnee Hotel Adaptation: Advising Local Governments on Climate Change Vulnerability March 12, 2009 2 Planning for Climate Vulnerability Exec.
Salt Dynamics in prairie wetlands under changing climate
 Salt Dynamics in prairie wetlands under changing climate Uri Nachshon Andrew Ireson Garth van der Kamp Howard Wheater Ryan Davies GIWS, University of Saskatchewan GIWS, University of Saskatchewan Environment
The Texas A&M University and U.S. Bureau of Reclamation Hydrologic Modeling Inventory (HMI) Questionnaire
 Questionnaire") The Texas A&M University and U.S. Bureau of Reclamation Hydrologic Modeling Inventory (HMI) Questionnaire May 4, 2010 Name of Model, Date, Version Number Dynamic Watershed Simulation Model (DWSM) 2002
The Texas A&M University and U.S. Bureau of Reclamation Hydrologic Modeling Inventory (HMI) Questionnaire May 4, 2010 Name of Model, Date, Version Number Dynamic Watershed Simulation Model (DWSM) 2002
Linking hydrology to erosion modelling in a river basin decision support and management system
 Integrated Water Resources Management (Proceedings of a symposium held at Davis. California. April 2000). I APIS Publ. no. 272. 2001. 243 Linking hydrology to erosion modelling in a river basin decision
Stormwater Infiltration using Dry Wells as a Low Impact Development (LID) Tool
 Tool") Stormwater Infiltration using Dry Wells as a Low Impact Development (LID) Tool Presented by: Connie Nelson, CFM City of Elk Grove/Willdan Engineering Today s Discussion Background California s water situation
Stormwater Infiltration using Dry Wells as a Low Impact Development (LID) Tool Presented by: Connie Nelson, CFM City of Elk Grove/Willdan Engineering Today s Discussion Background California s water situation
Afternoon Lecture Outline
 Afternoon Lecture Outline 1. Northern Prairies watershed hydrology 2. Solute mass balance in lakes and ponds 3. Simple mass balance simulation using MS Excel 4. Effects of sediment-water exchange on lake
Application of a Basin Scale Hydrological Model for Characterizing flow and Drought Trend
 Application of a Basin Scale Hydrological Model for Characterizing flow and Drought Trend 20 July 2012 International SWAT conference, Delhi INDIA TIPAPORN HOMDEE 1 Ph.D candidate Prof. KOBKIAT PONGPUT
Soil Water Monitoring Using Wireless Sensor Network
 Soil Water Monitoring Using Wireless Sensor Network Ruixiu Sui USDA-ARS Crop Production Systems Research Unit Stoneville, Mississippi Mississippi Water Resources Conference Jackson, MS April 7-8, 2015
Introduction to a MODIS Global Terrestrial Evapotranspiration Algorithm Qiaozhen Mu Maosheng Zhao Steven W. Running
 Introduction to a MODIS Global Terrestrial Evapotranspiration Algorithm Qiaozhen Mu Maosheng Zhao Steven W. Running Numerical Terradynamic Simulation Group, Dept. of Ecosystem and Conservation Sciences,
Afternoon Lecture Outline. Northern Prairie Hydrology
 Afternoon Lecture Outline 1. Northern Prairies watershed hydrology 2. Solute mass balance in lakes and ponds 3. Simple mass balance simulation using MS Excel 4. Effects of sediment-water exchange on lake
Water Education Foundation Briefing Water Year 2016: San Joaquin Valley Groundwater Conditions
 Groundwater in Fractured Rock Aquifers Well Location, Yield, and Sustainability Water Education Foundation Briefing Water Year 2016: San Joaquin Valley Groundwater Conditions John Kirk, PG, CEG, CHG Engineering
The Impacts of Climate Change on Portland s Water Supply
 The Impacts of Climate Change on Portland s Water Supply Richard Palmer and Margaret Hahn University of Washington Department of Civil and Environmental Engineering Joe Dvorak, Dennis Kessler, Azad Mohammadi
Simple toolbox for worldwide topography based soils reclassification for initialization of SWAT
 Simple toolbox for worldwide topography based soils reclassification for initialization of SWAT Daniel R. Fuka, Charlotte MacAlister, Solomon Seyoum, Todd Walter, Zachary Easton Cornell University IWMI
Norman Maclean Snowmelt Flow rate Storm flows fs (c flow m a tre S
 Eventually, all things merge into one, and a river runs through it. Norman Maclean Understanding Streamflow ADEQ SW Short Course June 13, 213 Phoenix, AZ Hydrographs Discharge (Q) USGS flow data & plots
Ch 18. Hydrologic Cycle and streams. Tom Bean
 Ch 18. Hydrologic Cycle and streams Tom Bean Wednesday s outline 1. the hydrologic cycle reservoirs cycling between them Evaporation and the atmosphere 2. Surface hydrology infiltration and soil moisture
AgriMet: Reclamation s Pacific Northwest Evapotranspiration Network
 AgriMet: Reclamation s Pacific Northwest Evapotranspiration Network Peter L. Palmer 1 ABSTRACT In 1983, the Bureau of Reclamation (Reclamation) and Bonneville Power Administration (BPA) partnered to create
Potato Lake 2010 Project Results and APM Plan. Saturday May 28, 2011 Dave Blumer, Jake Macholl SEH Lake Scientists
 Potato Lake 2010 Project Results and APM Plan Saturday May 28, 2011 Dave Blumer, Jake Macholl SEH Lake Scientists Lake and Aquatic Plant Management Planning Goal: To maintain or improve the overall condition
Climate Change in the Columbia Basin. Stephanie Smith Manager of Hydrology, BC Hydro
 Climate Change in the Columbia Basin Stephanie Smith Manager of Hydrology, BC Hydro June 20, 2017 Outline Climate change in the Columbia River basin What has happened? What could happen? What can we do
Ponds. Pond A water impoundment made by excavating a pit, or constructing a dam or an embankment.
 POND SITE SELECTION AND CONSTRUCTION Uses, Planning, & Design David Krietemeyer Area Engineer USDA-NRCS June 20, 2008 Uses Considerations for Location of Commonly Used Terms Pond A water impoundment made
Ozone and Modeled Stomatal Conductance at a High Elevation Subalpine Site in Southeastern Wyoming 1
 Ozone and Modeled Stomatal Conductance at a High Elevation Subalpine Site in Southeastern Wyoming 1 Robert C. Musselman, Karl F. Zeller, and Nedialko T. Nikolov 2 Abstract Ozone concentrations have been
Mike Jastremski, CFM Watershed Conservation Director
 Planning for Flood Resilient and Fish Friendly Road-Stream Crossings in CT s Northwest Hills Mike Jastremski, CFM Watershed Conservation Director Presentation Outline Project area Climate threats Field
Chapter 3 Physical Factors Affecting Runoff
 Chapter 3 Physical Factors Affecting Runoff Copyright 2003 David G Tarboton, Utah State University CHAPTER 3: PHYSICAL FACTORS AFFECTING RUNOFF The general climatic regime controls the total volume of
21st Century Climate Change In SW New Mexico: What s in Store for the Gila? David S. Gutzler University of New Mexico
 21st Century Climate Change In SW New Mexico: What s in Store for the Gila? David S. Gutzler University of New Mexico gutzler@unm.edu Silver City, NM June 5, 2008 Global Warming in the 20th/Early 21st
Hydrology and Water Management. Dr. Mujahid Khan, UET Peshawar
 Hydrology and Water Management Dr. Mujahid Khan, UET Peshawar Course Outline Hydrologic Cycle and its Processes Water Balance Approach Estimation and Analysis of Precipitation Data Infiltration and Runoff
Water Supply Board Briefing. Water Operations Department March 22, 2016
 Water Supply Board Briefing Water Operations Department March 22, 2016 Water Supply Briefing California Water Supply District Water Supply Water Supply Projections Water Supply Schedule 2 California Water
E. STORMWATER MANAGEMENT
 E. STORMWATER MANAGEMENT 1. Existing Conditions The Project Site is located within the Lower Hudson Watershed. According to the New York State Department of Environmental Conservation (NYSDEC), Lower Hudson
NREM 407/507 WATERSHED MANAGEMENT
 NREM 407/507 WATERSHED MANAGEMENT Please pick up Syllabus, Reading Material & Today s Lab on the Table in the Front Dick Schultz Instructor Sara Berges Teaching Assistant January 13, 2009 1. Conduct Get
Re-plumbing Roadside Ditch Networks
 Re-plumbing Roadside Ditch Networks Ditches Improving management to reduce flooding, water pollution, and in-stream erosion and habitat degradation Rebecca Schneider Dept. Natural Resources Cornell University,
Modelling Dissolved Organic Carbon and Nitrogen in Streams and Rivers Across Atlantic Canada
 Modelling Dissolved Organic Carbon and Nitrogen in Streams and Rivers Across Atlantic Canada Marie France Jutras, Mina Nasr, Thomas Clair, Paul Arp Presented by: Marie France Jutras Introduction OBJECTIVES:
Lecture 11: Water Flow; Soils and the Hydrologic Cycle
 Lecture 11: Water Flow; Soils and the Hydrologic Cycle Water Flow in Soils Types of Water Flow in Soil Saturated flow: Soil pores completely filled with water; controlled by the hydrostatic potential After
Uncertainty in Hydrologic Modelling for PMF Estimation
 Uncertainty in Hydrologic Modelling for PMF Estimation Introduction Estimation of the Probable Maximum Flood (PMF) has become a core component of the hydrotechnical design of dam structures 1. There is
WECC Observatory: Western Canadian Arctic Trail Valley Creek & Havikpak Creek Philip Marsh
 WECC Observatory: Western Canadian Arctic Trail Valley Creek & Havikpak Creek Philip Marsh Wilfrid Laurier University (& Environment Canada) + Numerous collaborators: Bill Quinton, Jenn Baltzer, Daqing
Change for Western North America. Hydrologic Implications of Climate. and the Columbia River Basin. Dennis P. Lettenmaier. Alan F.
 Hydrologic Implications of Climate Change for Western North America and the Columbia River Basin Alan F. Hamlet, Philip W. Mote, Dennis P. Lettenmaier JISAO/CSES Climate Impacts Group Dept. of Civil and
Climate Change, Precipitation Trends and Water Quality David S. Liebl
 Climate Change, Precipitation Trends and Water Quality David S. Liebl Wisconsin Lakes Partnership Convention Stevens Point 4/25/14 Map - Kate Barrett Wisconsin Precipitation Trends: 1950-2006 Annual Summer
Carbon Fluxes in Tropical Dry Forests and Savannas: Human, Ecological and Biophysical Dimensions
 Carbon Fluxes in Tropical Dry Forests and Savannas: Human, Ecological and Biophysical Dimensions Dr. Arturo Sanchez-Azofeifa Earth and Atmospheric Sciences Department University of Alberta, Edmonton, Alberta,
CHAPTER 4 DISCUSSION. Total Flow. For the study watershed, the water budget equation is defined as inflow equals
 CHAPTER 4 DISCUSSION Total Flow For the study watershed, the water budget equation is defined as inflow equals outflow minus any losses. Inflow consists of precipitation. Outflow consists of stream flow
The Fourth Assessment of the Intergovernmental
 Hydrologic Characterization of the Koshi Basin and the Impact of Climate Change Luna Bharati, Pabitra Gurung and Priyantha Jayakody Luna Bharati Pabitra Gurung Priyantha Jayakody Abstract: Assessment of
Summary of Water Monitoring Data
 Clay County Drainage Site Summary of Water Monitoring Data 2011 2015 Introduction The Red River Valley in northwestern Minnesota is experiencing an increase in the amount of agricultural subsurface drainage
Embankment and cut slope monitoring and analysis
 Embankment and cut slope monitoring and analysis Dr Derek Clarke and Dr Joel Smethurst Introduction - to understand the behaviour of clay slopes (natural/engineered/stabilised) - failure and serviceability
1.6 Influence of Human Activities and Land use Changes on Hydrologic Cycle
 1.6 Influence of Human Activities and Land use Changes on Hydrologic Cycle Watersheds are subjected to many types of changes, major or minor, for various reasons. Some of these are natural changes and
Rags to Riches - The RVCA Story of Science to Stewardship
 Rags to Riches - The RVCA Story of Science to Stewardship Rideau Valley Conservation Authority Eastern Ontario On Shield off Shield Large Urban population (Ottawa) Rideau Canal connecting St Lawrence to
Effects of land-cover changes on the hydrological response of interior Columbia River basin forested catchments
 HYDROLOGICAL PROCESSES Hydrol. Process. 16, 2499 252 (22) Published online in Wiley InterScience (www.interscience.wiley.com). DOI: 1.12/hyp.117 Effects of land-cover changes on the hydrological response
Climate Change Impacts in Washington State
 Climate Change Impacts in Washington State Lara Whitely Binder Climate Impacts Group College of the Environment University of Washington Evergreen College January 13, 2016 Climate Science in the Public
Stanley J. Woodcock, Michael Thiemann, and Larry E. Brazil Riverside Technology, inc., Fort Collins, Colorado
 7.5 FRASER RIVER EXTENDED STREAMFLOW PREDICTION SYSTEM Stanley J. Woodcock, Michael Thiemann, and Larry E. Brazil Riverside Technology, inc., Fort Collins, Colorado Esther Vincent and Andy Pineda * Northern
Event and Continuous Hydrological Modeling with HEC- HMS: A Review Study
 Event and Continuous Hydrological Modeling with HEC- HMS: A Review Study Sonu Duhan *, Mohit Kumar # * M.E (Water Resources Engineering) Civil Engineering Student, PEC University Of Technology, Chandigarh,
Chapter 2: Aquifers and groundwater
 Chapter 2: Aquifers and groundwater Groundwater movement through aquifers is driven by differences in groundwater levels or pressure and is controlled by how porous the material is that it passes through.
Challenges with Measuring Cover System Performance
 Challenges with Measuring Cover System Performance http://www.chezcora.com/sas katoon Mike O Kane, O Kane Consultants Inc. and Lee Barbour, University of Saskatchewan 21 st ANNUAL BRITISH COLUMBIA-MEND
Hydrologic Implications of Climate Change for the Western U.S., Pacific Northwest, and Washington State
 Hydrologic Implications of Climate Change for the Western U.S., Pacific Northwest, and Washington State Alan F. Hamlet JISAO/CSES Climate Impacts Group Dept. of Civil and Environmental Engineering University
Tools for Improving Irrigation Management of Vegetables
 Tools for Improving Irrigation Management of Vegetables Michael Cahn Irrigation and Water Resources Advisor University of California, Cooperative, Monterey Co Nitrate is part of the Agricultural Discharge
Land Use, Water Quality, and
 Land Use, Water Quality, and Carbon in the Southern Appalachians Paul Bolstad 1, Ryan Kirk 1, Mark Riedel 2, James Vose 2, Dave Wear 2 3 Ted Gragson, 3 David Leigh, 3 Ned Gardiner, 4 Mark Scott 1 University
Uncertainty in projected impacts of climate change on water
 1928 2000 Uncertainty in projected impacts of climate change on water Ed Maurer Civil Engineering Cambio Climático y Políticas Públicas Centro de Cambio Global Universidad Católica de Chile 23 abril 2009
DEVELOPMENT OF A NUTRIENT BUDGET APPROACH AND OPTIMIZATION OF FERTILIZER MANAGEMENT IN WALNUT
 DEVELOPMENT OF A NUTRIENT BUDGET APPROACH AND OPTIMIZATION OF FERTILIZER MANAGEMENT IN WALNUT Theodore DeJong, Katherine Pope, Patrick Brown, Bruce Lampinen, Jan Hopmans, Allan Fulton, Richard Buchner,
Study Justification. Coordinated Resource Management Project Little Snake River Conservation District
 Trends in Surface-Water Quality of the Muddy Creek asin: Carbon County, Wyoming C.. Ellison, Q. D. Skinner and L. S. Hicks Department of Renewable Resources University of Wyoming Funded by: Little Snake
H1: Watershed land use and stream bank morphology determine sediment load and P- N speciation sensitive to timing, frequency, and intensity of rain-sn
 Question 1: What is the relative importance of endogenous inlake processes (e.g. internal loading, ice cover, hydrodynamics) versus exogenous to-lake processes (e.g. land use change, snow/rain timing,
Hydrologic Cycle. Water Availabilty. Surface Water. Groundwater
 Hydrologic Cycle Hydrologic ydoogccyce cycle Surface Water Groundwater Water Availabilty 1 Hydrologic Cycle Constant movement of water above, on, and, below the earth s surface (Heath) Endless circulation
IPM Scopes 6/19/2015. The Growers Tool Box. Don t let pests catch you by surprise. Meters & Devices to Improve Plant Quality
 Cultivate 15 The Growers Tool Box Meters & Devices to Improve Plant Quality IPM Scopes Don t let pests catch you by surprise IPM Scope View live images on the computer screen 40x and 140x magnification