To support any sound energy policy
|
|
|
- Dylan Gibbs
- 6 years ago
- Views:
Transcription
1 International Workshop on Energy Statistics Mexico, 2-5 December 2008 Do traditional supply-demand data give a sufficient basis for sound energy efficiency policies? Introduction to Energy Efficiency Indicators Jean-Yves Garnier Energy Statistics Division International Energy Agency
2 Why is it important to have detailed energy efficiency indicators? To support any sound energy policy A need to know what are the sub-sectors sectors which consume too much energy (ex: trucks, heating, cement, offices,..) What is too much? A need to have benchmarking and best practices A need to compare with the situation in similar countries (climate, size, economy, ) To monitor progresses (or failures) of actions and programs on energy efficiency To be used as the basis for detailed modeling and forecasts
3 Contribution to Energy Savings from Sectors and End Uses 100% 80% Other Manufacturing 14% IEA-11 Space Heating 19% otal savings Percent of t 60% 40% 20% 0% Japan US EUR-8 Primary Metals 13% Nonmetallic Minerals 4% Chemicals 9% Paper & Pulp 2% Service 18% Appliances 3% Other Household 1% Car Travel 8% Air Travel 6% Truck Freight 1% Other Freight 2% Freight Transport Passenger Transport Households Service Manufacturing Indicators are useful to understand the past
4 as well as the future 1000 Other Electri icity con nsumptio on (TWh) 900 Circulation pumps PCs Standby Television i Dishwashing Clothes-drying Clothes-washing Refrigeration Lighting 200 Cooking Water heating Space cooling Space heating
5 1997 The more detailed information you collect the better you know what really happens 160% 150% 140% Total Energy 130% 120% 110% Basic energy statistics 1973 = 100% 100% 90% 80% 70%
6 1997 The more detailed information you collect the better you know what really happens 160% Total Energy 150% Total Energy, CC 140% 130% 120% 100% 110% 1973 = 100% 90% 80% 70%
7 1997 The more detailed information you collect the better you know what really happens 160% Total Energy 150% Total Energy, CC Total/Capita 140% 120% = 100% 130% 110% 1973 = 100% 90% 80% 70%
8 The more detailed information you collect the better you know what really happens 160% 150% 140% Total Energy Total Energy, CC Total/Capita Total/household 130% 1973 = 100% 120% 110% 100% 90% 80% 70%
9 The more detailed information you collect the better you know what really happens 130% 1973 = 100% 160% 150% 140% 120% 110% 100% Total Energy Total Energy, CC Total/Capita Total/household Total/Sq. m 90% 80% 70%
10 The more detailed information you collect the better you know what really happens 160% Total Energy 130% 1973 = 100% 150% 140% 120% 110% 100% Total Energy, CC Total/Capita Total/household Total/Sq. m Space heat/sq. m 90% 80% 70%
11 The more detailed information you collect the better you know what really happens 130% 1973 = 100% 160% Total Energy Total Energy, CC 150% Total/Capita Total/household Total/Sq. m 140% Space heat/sq. m Useful space heat/sq. m 120% 110% 100% 90% 80% Detailed indicators 70%
12 The more detailed information you collect the better you know what really happens 160% 150% Total Energy Space heat/sq. m 1973 = 140% 120% = 100%130% 110% 100% Macro and micro data can lead to diverging conclusions Macro 90% Micro 80% 70%


13 No breakdown by end use: - heating - DHW - lighting - cooking - air conditioning - appliances Energy Balance People's Republic of China / République populaire de Chine : 2005 Thousand tonnes of oil equivalent / Milliers de tonnes d'équivalent pétrole SUPPLY AND Coal Crude Petroleum Gas Nuclear Hydro Geotherm. Combust. Electricity Heat Total CONSUMPTION Oil Products Solar Renew. etc. & Waste APPROVISIONNEMENT Charbon Pétrole Produits Gaz Nucléaire Hydro Géotherm. Comb. Electricité Chaleur Total ET DEMANDE brut pétroliers solaire ren. & déchets Production Imports Exports Intl. Marine Bunkers Stock Changes TPES Transfers Statistical Differences Electricity Plants CHP Plants Heat Plants Gas Works Petroleum Refineries Coal Transformation Liquefaction Plants Other Transformation Own Use Distribution Losses TFC INDUSTRY SECTOR Iron and Steel Chemical and Petrochemical Non-Ferrous Metals Non-Metallic Minerals Transport Equipment No breakdown by end Machinery Mining and Quarrying Food and Tobacco use - and 1577 by 218function - - of Paper Pulp and Printing Wood and Wood Products Construction 3200 buildings (hospitals, Textile and Leather Non-specified 4642 schools, hotels, 98 - offices, TRANSPORT SECTOR International Aviation - restaurants, etc.) Domestic Aviation Road Rail Pipeline Transport Domestic Navigation Non-specified OTHER SECTORS Residential Comm. and Publ. Services Agriculture/Forestry Fishing Non-specified NON-ENERGY USE in Industry/Transf./Energy of which: Feedstocks in Transport in Other Sectors What most organisations collects on a regular basis is limited to aggregated levels OTHER SECTORS Residential Comm. & Pub. Services Agriculture/Forestry Fishing Electr. Generated - GWh Electricity Plants CHP Plants Non-specified Heat Generated - TJ CHP Plants Heat Plants
14 Only a minimum set of indicators can be derived from basic statistics OECD China India World
15 Only a minimum set of indicators can be derived from basic statistics OECD China India World Production Mtoe TPES Mtoe Electricity Consumption TWh CO 2 Emissions Mt of CO
16 Only a minimum set of indicators can be derived from basic statistics OECD China India World Production Mtoe TPES Mtoe Electricity Consumption TWh CO 2 Emissions Mt of CO Production/TPES TPES/GDP toe / $ TPES/GDP(PPP) toe / $ PPP TPES/Population toe / capita
17 Only a minimum set of indicators can be derived from basic statistics OECD China India World Production Mtoe TPES Mtoe Electricity Consumption TWh CO 2 Emissions Mt of CO Production/TPES TPES/GDP toe / $ TPES/GDP(PPP) toe / $ PPP TPES/Population toe / capita Elec. Cons/Population kwh / capita


18 Only a minimum set of indicators can be derived from basic statistics OECD China India World Production Mtoe TPES Mtoe Electricity Consumption TWh CO 2 Emissions Mt of CO Production/TPES TPES/GDP toe / $ TPES/GDP(PPP) toe / $ PPP TPES/Population toe / capita Elec. Cons/Population kwh / capita CO 2 / TPES t CO 2 / toe CO 2 /GDP kg CO 2 / 2000 $ CO 2 / GDP (PPP) kg CO 2 / 2000 $ PPP CO 2 / Population t CO 2 / capita
19 Efficiency of Electricity Generation in Electricity plants Coal Australia Austria Belgium Canada Czech Rep. Denmark Finland Coal France Germany Greece Hungary Iceland Ireland Italy Japan Korea Efficiency of Electricity Generation in Electricity Plants 33% 42% 38% 38% 36% 42% 41% 39% 39% 35% 32% 39% 37% 42% 36% Oil Efficiency of Electricity Generation in Electricity Plants Australia 33% Austria Belgium Canada Czech Rep. 39% 41% 40% 36% Denmark 20% Finland 38% Coal Oil France 37% Germany 40% Greece 36% Hungary 35% Iceland 30% Ireland 36% Italy 38% Japan 42% Korea 38% Luxembourg Luxembourg Mexico 36% Mexico 34% Netherlands 41% Netherlands NZ 34% NZ 30% Norway 65% Norway Poland Poland Portugal 40% Portugal 39% Slovak Rep. 30% Slovak Rep. 21% Spain 38% Spain 35% Sweden Sweden 41% Switzerland Switzerland Turkey 35% Turkey 35% UK 38% UK 29% USA 36% USA 35% South Africa 37% South Africa Brazil 29% Brazil 34% India 27% India 26% China 32% China 34% Russia Russia 0% 20% 40% 60% 80% 100% 0% 20% 40% 60% 80% 100% average average


 Dry")
20 The Indicator Pyramid TPES/GDP TPES/Production Electricity Cons./Population Aggregated CO2/GDP PPP Indicators Efficiency i Elec. Prod. Only a minimum set of indicators can be derived from basic statistics Disaggregated Indicators Process Efficiency Cons./ton cement Heating Cons./sqm/DD Litre/100km (stock) Dry process Condensing boiler Litre/100km (vintage)

21 Analysts need more detailed data EJ Hypothetical energy use without efficiency improvements Actual energy use Energy Savings 56% Contribution of energy efficiency to limited increases in IEA energy consumption Average annual perc cent change 2% 1% 0% -1% Manufac-Households*Serviceturing transport Passenger Freight Other** transport Total 100% Long-term Economy-wide Energy Savings from Improvements in Energy Efficiency 80% 60% 40% 20% 0% 28% 23% 16% 24% 23% 17% 21% 23% 10% 10% Average annual perc cent change 3% 2% 1% 0% Hypothetical energy use without energy efficiency improvements Energy efficiency improvements Actual energy use Energy efficiency improvements Actual energy use Impact of Energy Efficiency Improvements on Final Energy Use, IEA11
22 So, what could be done to bridge the gap (the IEA s example) Priority was given to cooperation Data on industry: network of industry association (WBCSD) Data on residential, services, transport: cooperation with the ODYSSEE programme of the European Commission for EU countries Cooperation with APEC for APEC Member Economies Direct contacts with national administrations (e.g. EIA (USDOE) for RECS, MECS, ) In 2006, the IEA defined templates to ease the reporting of the basic data by countries


23 The initial templates
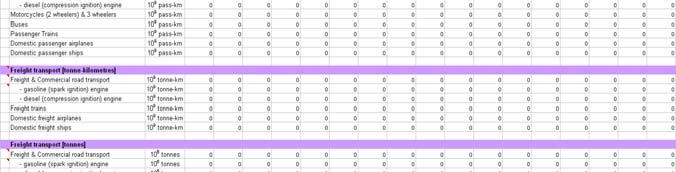
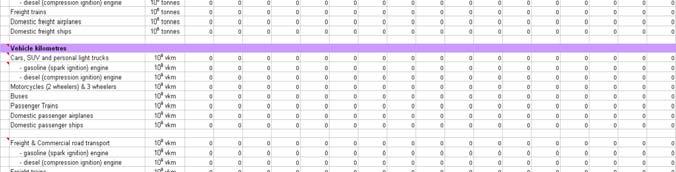
24 TRANSPORT Detailed data on transport 10 6 Veh-km nnes-km tonnes Ton pass-km
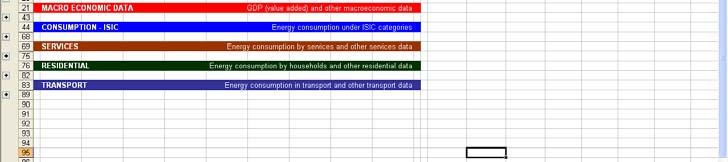
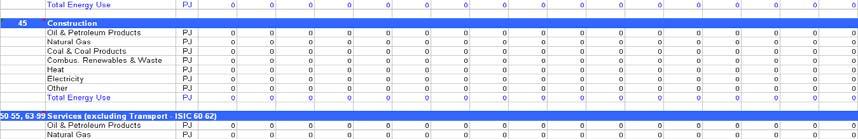
25 Energy consumption broken down by end use Services Space Heating Space Cooling Lighting Other Energy Use in Services Sector
26 Diffusion, stocks and average consumption of selected appliances RESIDENTIAL % 10 6 kwh/ /unit
 Last year: 2004 (Y-3) Yes, but still 10 OECD")

27 Payback on Investment Published in 2004 Published in IEA countries 20 IEA countries Last year: 1998 (Y-6) Last year: 2004 (Y-3) Yes, but still 10 OECD countries missing Data are not available for all sectors in all countries Coverage does not include major Non-OECD countries Joint work with World Bank/LBNL to extend coverage


28 Despite all the efforts there is a risk of widening and worrying gap between the interest for indicators and the resources allocated to collect proper supporting data For instance, 149 participants in the meeting on efficiency goals Increasing Interest for Indicators The 3Is vs. the 3Ds Dramatic Decrease in Data resources Statistics and statisticians are at the basis of the pyramid and constitute the foundation for any sound analysis and policy
29 So, an urgent need to fill the gap by collecting and providing proper p data to analysts The initial templates could constitute a good common tool to collect the data Once again, priority was given to cooperation A two-day retreat with the EU-ODYSSEE people to see how questionnaires could be harmonised Cooperation with APEC Meeting with LBNL to check consistency Further workshop with industry association (WBCSD) The templates/questionnaire have been revised to take into consideration comments and be more userfriendly
30 A quick look at the new templates List of countries Built-in indicators and graphs Menu driven
31 RESIDENTIAL Pre-filled time series Space Heating Space Cooling Water Heating Cooking
32 A large choice of indicators for sector end use Built-in graphs of indicators
33 Why such a gap between the need to have detailed indicators and the difficulty to build them Lack of discussion and understanding between the parties Lack of resources Lack k off expertise i and d experience i
34 Lack of expertise and experience The past situation in energy statistics offices 40s 50s Retirement age 20s 30s gaining experience passing experience
35 The current situation environment modelling private sector 50s Retirement age 40s 20s 30s efficiency policy Temptation to move away from statistics is high Young statisticians only stay a few years Not enough time to have a full grasp of energy statistics No time to transmit their expertise
36 Why such a gap between the need to have detailed indicators and the difficulty to build them Lack of discussion and understanding between the parties Lack of resources Lack of expertise and experience On January 2009, the IEA will organise a workshop to bring around the same table policy makers and energy analysts in charge of energy efficiency indicators as well as statisticians. The workshop is opened to both OECD and selected non-oecd countries. The objective is to highlight gaps and barriers in building and using energy efficiency indicators and to hear from successful countries solutions and best practices. Another objective is to discuss the role of organisations in helping countries building the expertise and capacity to work on indicators.
37 There is an urgent need to act and react The Nobel Prize for Peace has been attributed to work on what the state of the planet could be in the next decades. In March, the OECD published another alarming report However, we do not even know the current situation very well There is a global consensus from and for Governments to urgently take a series of measures to promote efficiency In order to optimise and prioritise these actions, there is first an obvious need to have an accurate view of the energy consumption in all sectors Of course, there is a cost associated to collecting and processing the necessary data. But non optimum decisions often lead to costs which are often much higher. A 1$/bl reduction in the price of oil is equivalent to saving of 85 M$ per day. A lot of money for collecting proper data which should lead to reduce the tension on the oil market and therefore price of oil.
38 There is an urgent need to act and react (cont.) The 145US$/bl sent a clear signal to consumers to do more on energy efficiency (even if prices have now dramatically decreased). Energy efficiency was at the centre of the discussion of the last IEA Ministerial meeting; it will also be one of the focuses of the discussions at the next G8 and G20 Summits in Hokkaido-Toyako. There is no one single silver bullet to establish sound energy efficiency policies. However, having a solid understanding of who consumes what is a prerequisite for any plan of actions. So the importance of having a detailed and timely database. Priorities vary from countries to countries (heating in some countries, biomass or rural electrification in others) A universal template should allow all countries to chose what to collect. The current template could be a starting point which needs to be enriched by inputs from many other organisations. As for the JODI initiative, cooperation between organisations is the main driver and their participation is essential for using the momentum and pulling their member countries with them. Thank you
Energy Efficiency Indicators Overview
 Energy Efficiency Policies in ASEAN Region Jakarta, 18-20 October 2011 Energy Efficiency Indicators Overview Nathalie Trudeau International Energy Agency Why collecting energy statistics Any sound energy
THE IMPORTANCE OF ENERGY EFFICIENCY INDICATORS. Robert Schnapp Energy Statistics Division International Energy Agency
 THE IMPORTANCE OF ENERGY EFFICIENCY INDICATORS Robert Schnapp Energy Statistics Division International Energy Agency Gt EFFICIENCY S ROLE IN CO 2 EMISSIONS ABATEMENT 42 40 Reference Scenario World abatement
From Basic Energy Statistics to Energy Balances. Workshop on Energy Statistics. Karen Tréanton. International Energy Agency
 International Energy Agency Karen Tréanton IEA Energy Statistics Division Head of Energy Balances, Prices and Emissions Section From Basic Energy Statistics to Energy Balances International Workshop on
Energy Efficiency Indicators Overview
 Energy Efficiency Indicators Overview The IEA energy efficiency indicators template Energy Statistics Training Paris, 4-8 March, 2013 Taejin Park Energy Efficiency Indicators World Energy Outlook 2012
The Importance of Energy Efficiency Indicators
 2-2 The Importance of Energy Efficiency Indicators Duncan Millard, Chief Statistician 16 th APEC Workshop on Energy Statistics, Tokyo 10 th 12 th July 2018 Outline Why is data important to policy What
Energy Efficiency Indicators: The Electric Power Sector
 Energy Efficiency Indicators: 5 Sectors, 5 Challenges Mexico City, Mexico 14-15 March 2011 Energy Efficiency Indicators: The Electric Power Sector Robert Schnapp Head, Coal, Renewables, Electric and Heat
Energy Efficiency Indicators: Fundamentals on Statistics
 Energy Efficiency Indicators: Fundamentals on Statistics Roberta Quadrelli Head - Energy Balances, Prices, Emissions, Efficiency Energy Data Centre Energy Statistics Training IEA, Paris, October 2014 Developing
Energy Efficiency Indicators: Fundamentals on Statistics
 Energy Efficiency Indicators: Fundamentals on Statistics Taejin PARK Energy Data Manager Energy Data Centre Energy Statistics Training IEA, Egypt, October 23 2014 Developing energy efficiency indicators:
The IEA methodology for energy efficiency indicators Roberta Quadrelli Head - Energy Balances, Prices, Emissions, Efficiency IEA Energy Data Centre
 The IEA methodology for energy efficiency indicators Roberta Quadrelli Head - Energy Balances, Prices, Emissions, Efficiency IEA Energy Data Centre INOGATE regional workshop Minsk, September 2015 Why do
The importance of energy and activity data for technology policy modeling
 The importance of energy and activity data for technology policy modeling 2016 InterEnerStat Workshop: Energy efficiency and end-use data and Meeting of Organisations 14 December 2016, Paris Eric Masanet,
B U I L D I N G P A R T N E R S H I P S F O R E N E R G Y S E C U R I T Y
 Importance of reliable and comparable energy statistics and energy efficiency indicators in national policies Kyiv, 8 October 2014 Peter Dal, Senior Expert B U I L D I N G P A R T N E R S H I P S F O R
Energy and CO 2 emissions in the OECD
 Energy and CO 2 emissions in the OECD With detailed supply and demand data up to 216 1 1. Data based on the 218 preliminary editions of the IEA World energy balances, and the IEA CO 2 Emissions from fuel
Global Energy Production & Use 101
 Global Energy Production & Use 101 Jean-Sébastien Rioux The School of Public Policy SPP-HEI Summer School on the Geopolitics of Energy & Natural Resources Calgary, AB May 15-20, 2017 Presentation highlights
Energy Innovation Scoreboard A Pilot Framework with a Focus on Renewables
 Energy Innovation Scoreboard A Pilot Framework with a Focus on Renewables Claudia Kettner, Angela Köppl IEA Workshop on "Modelling and Analyses in R&D Priority-Setting and Innovation" IEA, 24 April 2014
Sectoral Profile - Industry
 Sectoral Profile - Industry Energy consumption Energy consumption trends in EU There is a regular decrease in energy consumption since 2003, although there was growth in industrial activity from 2003 to
Energy efficiency trends in EU industry
 Energy efficiency trends in EU industry Odyssee-Mure webinar series on Energy Efficiency organised by Leonardo ENERGY Bruno Lapillonne, Karine Pollier, Laura Sudries, Enerdata 16 November 2016 The webinar
Indicators to monitor energy efficiency progress: the IEA experience
 Indicators to monitor energy efficiency progress: the IEA experience Roberta Quadrelli Head - Energy Balances, Prices, Emissions, Efficiency IEA Energy Data Centre Capacity Development for Mainstreaming
ITAM Mexico City, 27 October 2016
 ITAM Mexico City, 27 October 2016 Founded in 1974 Formed in wake of 1973 oil embargo with mission to promote member country energy security -- autonomous agency of the Organisation for Economic Cooperation
INTERNATIONAL ENERGY AGENCY. In support of the G8 Plan of Action TOWARD A CLEAN, CLEVER & COMPETITIVE ENERGY FUTURE
 INTERNATIONAL ENERGY AGENCY In support of the G8 Plan of Action TOWARD A CLEAN, CLEVER & COMPETITIVE ENERGY FUTURE 2007 REPORT TO THE G8 SUMMIT in Heiligendamm, Germany The International Energy Agency,
Strong focus on market and policy analysis
 OECD/IEA - 2015 Founded in 1974 OECD agency 29 member countries 1 new applicant - Mexico 3 associate countries: China, Indonesia, Thailand 240 staff in Paris secretariat The European Commission also participates
energy in figures Energy
 EU energy in figures Statistical pocketbook 2015 Energy This publication does not involve the European Commission in liability of any kind. Europe Direct is a service to help you find answers to your questions
ISSN energy. in figures. Energy
 ISSN 1977-4559 EU energy in figures STATISTICAL POCKETBOOK 2014 Energy EU ENERGY IN FIGURES POCKETBOOK 2014 1 This publication does not involve the European Commission in liability of any kind. Europe
Energy & Climate Change ENYGF 2015
 Energy & Climate Change ENYGF 2015 Ellina Levina Environment & Climate Change Unit Sustainable Energy Policy and Technology, IEA 22 June 2015 29 Member Countries: Australia, Japan, Korea, New Zealand,
Gasification of Biomass and Waste Recent Activities and Results of IEA Bioenergy Task 33
 Gasification of Biomass and Waste Recent Activities and Results of IEA Bioenergy Task 33 Presentation made by: Berend Vreugdenhil (ECN, Netherlands) Presented by: Timo Gerlagh (RVO.nl, Netherlands) Beijing,
Energy Policies for Developing Countries: The Case of Namibia
 Energy Policies for Developing Countries: The Case of Namibia Hans-Joachim Ziesing 16 th Annual Meeting of the Reform Group Schloss Leopoldskron, Salzburg, August/September 2011 Agenda A more touristy
Working together to meet global energy challenges
 Working together to meet global energy challenges Staff on loan From around the world From IEA and OECD member countries: Australia Austria Belgium Canada Chile Czech Republic Denmark Estonia Finland France
COMMISSION STAFF WORKING DOCUMENT Accompanying the document REPORT FROM THE COMMISSION TO THE EUROPEAN PARLIAMENT AND THE COUNCIL
 EUROPEAN COMMISSION Brussels, 18.11.215 SWD(215) 245 final PART 1/2 COMMISSION STAFF WORKING DOCUMENT Accompanying the document REPORT FROM THE COMMISSION TO THE EUROPEAN PARLIAMENT AND THE COUNCIL Assessment
THE 2008 ROUND OF REVISIONS OF THE NON-MANUFACTURING REGULATION (NMR) AND REGULATORY IMPACT (RI) INDICATORS
 AND REGULATORY IMPACT (RI) INDICATORS") THE 2008 ROUND OF REVISIONS OF THE NON-MANUFACTURING REGULATION (NMR) AND REGULATORY IMPACT (RI) INDICATORS The Non-Manufacturing Regulation (NMR) and Regulatory Impact (RI) indicators have been updated,
THE 2008 ROUND OF REVISIONS OF THE NON-MANUFACTURING REGULATION (NMR) AND REGULATORY IMPACT (RI) INDICATORS The Non-Manufacturing Regulation (NMR) and Regulatory Impact (RI) indicators have been updated,
Supplementary Information
 Supplementary Information 1. Figures and Tables Showing Supplemental Information and Data 0.5 Energy Expenditures as Fraction of GDP (Actual) 0.4 0.3 0.2 0.1 0 1980 1990 2000 2010 Figure S1. The fraction
The Use of Energy Statistics to Estimate CO 2 Emissions
 The Use of Energy Statistics to Estimate CO 2 Emissions Joint IEA, ESCWA and RCREEE National Workshop on Energy Statistics Cairo, Egypt 27 April 01 May 2014 Outline International context Trends in emissions
Directorate: Energy Planning and Development
 DIGEST OF SOUTH AFRICAN ENERGY STATISTICS 2006 Directorate: Energy Planning and Development DEPARTMENT: MINERALS AND ENERGY REPUBLIC OF SOUTH AFRICA Directorate: Energy Planning and Development DIGEST
I N T E R N A T I O N A L E N E R G Y A G E N C Y KEY WORLD ENERGY STATISTICS
 I N T E R N A T I O N A L E N E R G Y A G E N C Y KEY WORLD ENERGY STATISTICS 2008 INTERNATIONAL ENERGY AGENCY 9, rue de la Fédération 75739 Paris Cedex 15 www.iea.org S T KEY WORLD ENERGY STATISTICS A
Power Generation: A Continued Role for Coal?
 Power Generation: A Continued Role for Coal? Keith Burnard Head, Energy Supply Technology Unit International Energy Agency Clean Coal Day Tokyo, Japan 8-9 September 2015 Founded in 1974 as an autonomous
ASEAN Energy Indicators
 ASEAN CENTRE FOR ENERGY ASEAN CENTRE FOR ENERGY July 2014 PREFACE The ASEAN Centre for Energy (ACE), an intergovernmental organisation, was established by the ASEAN Member Governments beginning on 01
Detailed Data from the 2010 OECD Survey on Public Procurement
 ANNEX G Detailed Data from the 2010 OECD Survey on Public Procurement This annex provides data for each responding country on the transparency of the public procurement cycle, as well as the online availability
Australian coal: supporting advanced coal-fired technologies
 Australian coal: supporting advanced coal-fired technologies Mike Lawson A/g Deputy Secretary, Department of Industry, Innovation and Science 5 September 2017 Overview Australia A long standing, reliable,
Energy Balances Overview
 Energy Balances Overview Energy Statistics Training IEA, Paris, 29 February 4 March 2016 Remi Gigoux Energy Balances Energy balances What is an energy balance? Why calculate an energy balance? How to calculate
Electricity and heat statistics
 Electricity and heat statistics Statistics Explained Data extracted in June 2018. Planned article update: June 2019. Gross electricity production by fuel, GWh, EU-28, 2000-2016Source: Eurostat (nrg105a)
What is the Energy of the Future? Nicolas Meilhan Principal Consultant, Frost & Sullivan
 What is the Energy of the Future? Nicolas Meilhan Principal Consultant, Frost & Sullivan April 2015 What is the energy of the past? Oil remains by far the main source of world energy, but has lost market
Best Practices for Promoting the Renovation of Buildings and the Interlinkage with the EPBD
 Workshop on Energy Efficiency, Savings obligations, public building targets and the promotion of CHP Policy Department A European Parliament Best Practices for Promoting the Renovation of Buildings and
IEA s Approach to Energy Statistics Training InterEnerStat Meeting, Dec. 2012
 Pierre Boileau Section Head, Non-OECD Country Statistics IEA Energy Data Center IEA s Approach to Energy Statistics Training InterEnerStat Meeting, Dec. 2012 Energy statistics training Overall philosophy
Renewables Questionnaire
 Renewables Questionnaire IEA Energy Statistics Training Pierre Boileau International Energy Agency OVERVIEW Renewable energy in the world Renewables energy sources IEA annual questionnaire On-going challenges
2016 Review. Poland. Energy Policies of IEA Countries. Corrigendum
 Energy Policies of IEA Countries Poland 2016 Review http://dx.doi.org/1787/9789264272309en ISBN: 9789264272309 (PDF) OECD/IEA 2016 Corrigendum Please note that despite our best efforts to ensure quality
Advantage Energy: Emerging economies, developing countries and the private-public sector interface
 Advantage Energy: Emerging economies, developing countries and the private-public sector interface USAEE Conference North America Conference David Elzinga david.elzinga@iea.org 10 October 2011 OECD/IEA
2010 Key World Energy
 2010 Key World Energy Statistics 9, rue de la Fédération 75739 Paris Cedex 15 www.iea.org S T KEY WORLD ENERGY STATISTICS A T I S T I C S IEA participating countries 2 Australia Austria Belgium Canada
How2Guide for Bioenergy. Ingrid Barnsley, Anselm Eisentraut Southeast Asia regional workshop July 2014, Bangkok, Thailand
 How2Guide for Bioenergy Ingrid Barnsley, Anselm Eisentraut Southeast Asia regional workshop 23-24 July 2014, Bangkok, Thailand OECD/IEA 2012 International Energy Agency Founded in 1974 Formed in wake of
Comparing the main indicators for population, GDP, energy, CO2 and electricity of China, USA, European Union and India
 Renewables International - wwwrenewablesinternatonalnet Comparing the main indicators for population, GDP, energy, CO2 and electricity of China, USA, European Union and India Bernard CHABOT Sustainable
IEA data collection on RES
 IEA data collection on RES Samantha Ölz Renewable Energy Unit Workshop on Data Gathering on Renewable Energies for New Member States and Candidate Countries Scientific Technical Reference System on Renewable
The Use of Energy Statistics to Estimate CO 2 emissions
 Karen Tréanton Head of Energy Balances, Prices and Emissions Energy Data Centre The Use of Energy Statistics to Estimate CO 2 emissions Joint Rosstat IEA Energy Statistics Workshop Moscow, 14-16 February
11 October, 2016, Petten
 11 October, 2016, Petten The REmap approach IRENA s REmap programme explores potential, cost and benefits of doubling the share of renewables in global energy mix (SE4ALL objective), key to realize SDG
Evolution of Production Network: Measuring Trade in value-added (TiVA)
") Evolution of Production Network: Measuring Trade in value-added (TiVA) Norihiko YAMANO Directorate for Science Technology and Industry, OECD Working Party on Globalisation of Industry Committee on Industry,
Evolution of Production Network: Measuring Trade in value-added (TiVA) Norihiko YAMANO Directorate for Science Technology and Industry, OECD Working Party on Globalisation of Industry Committee on Industry,
Highlights. Figure 1. World Marketed Energy Consumption by Region,
 Highlights World energy consumption is projected to increase by 71 percent from 3 to 23. Fossil fuels continue to supply much of the energy used worldwide, and oil remains the dominant energy source. In
DISTRICT HEATING AND COOLING 2005 STATISTICS
 DISTRICT HEATING AND COOLING 2005 STATISTICS 432 2005 unit Austria Bulgaria Czech Russia Croatia Denmark Finland Germany Estonia Hungary Iceland Italy Korea Latvia Lithuania Netherlands Norway Poland Romania
The Use of Energy Statistics to Estimate CO 2 emissions
 The Use of Energy Statistics to Estimate CO 2 emissions IEA Energy Statistics Training Paris, 4-8 March, 2013 Aidan Kennedy CO 2 Emissions Outline International context IPCC methodologies (notes on bunkers
Urban Energy Use and Carbon Emissions. Matthias Ruth WEO Team Member Center for Integrative Environmental Research University of Maryland
 Urban Energy Use and Carbon Emissions Matthias Ruth WEO Team Member Center for Integrative Environmental Research University of Maryland World Bank Energy Week 2009: Energy Efficient Cities Session The
Introduction to Energy Statistics and to IEA Energy Statistics
 IEA Energy Statistics Training Week IEA, Paris, 4-8 March 2013 Introduction to Energy Statistics and to IEA Energy Statistics Why and how to collect necessary energy statistics Jean-Yves Garnier Head,
Renewable Energy and APEC Energy Statistics
 Renewable Energy and APEC Energy Statistics 42 nd Meeting APEC Expert Group on New and Renewable Energy Technology Moana Surfrider, A Westin Resort & Spa Honolulu, U.S.A 8 th April 2014 Takuya MIYAGAWA
Energy efficiency: the first fuel Savings from efficiency 60% of TFC in Mtoe TFC and savings within IEA countries (
 Energy Efficiency Today: IEA s 2015 Market Report IEEJ, Tokyo, October 6, 2015 Philippe Benoit, Head, Energy Efficiency and Environment Division International Energy Agency Energy efficiency: the first
Rethinking E-Government Services
 Rethinking E-Government Services Session 3: Serving Citizens Becoming User-focused in the Provision of E-Government Services OECD-India meeting 4 December 2009 New Delhi, India Yih-Jeou Wang Head of Unit
Philippe Benoit, Division Head Energy Efficiency and Environment Division ENEA, Rome, 15 October 2014
 Energy Efficiency i Market Report 2014 Philippe Benoit, Division Head Energy Efficiency and Environment Division ENEA, Rome, 15 October 2014 IEA fuel market reports IEA 2013 IEA fuel market reports IEA
Data, tables, statistics and maps ENERGY IN DENMARK
 Data, tables, statistics and maps ENERGY IN DENMARK 215 1 1 GENERAL INFORMATION ON DENMARK Energy in Denmark, 215 Contents General information on Denmark 3 Energy production 4 Imports and exports of energy
UPDATE OF CEM FURTHER EVENTS AND CHP/DHC WORKING GROUP
 UPDATE OF CEM FURTHER EVENTS AND CHP/DHC WORKING GROUP CLEAN ENERGY MINISTERIAL CHP/DHC WORKING GROUP INTERNATIONAL ENERGY AGENCY CHP/DHC COLLABORATIVE JOINT WORKSHOP 26 27 TH NOVEMBER, 2013 HELSINKI,
Data, tables, statistics and maps ENERGY IN DENMARK
 Data, tables, statistics and maps ENERGY IN DENMARK 216 Energy in Denmark, 216 Contents General information on Denmark 3 Energy production 4 Imports and exports of energy 8 Electricity and heat 9 Danish
TABLE 2. SUPPLY, TRANSFORMATION, ENERGY SECTORS AND END USE. 13 energy products 60 flows divided into 6 sections Supply Transformation Sector
 TABLE 2. SUPPLY, TRANSFORMATION, ENERGY SECTORS AND END USE Country Geothermal Solar Thermal Industrial Waste (nonrenewable) MUNICIPAL WASTE SOLID BIOMASS BIOGAS LIQUID BIOFUELS Renewable Non-Renewable
ODYSSEE-MURE, a decision support tool for energy efficiency policy evaluation. Recent energy efficiency trends in the EU
 ODYSSEE-MURE, a decision support tool for energy efficiency policy evaluation Recent energy efficiency trends in the EU Didier Bosseboeuf, ADEME, project coordinator Bruno Lapillonne, Karine Pollier; Enerdata
IEA WORK ON FUTURE ELECTRICITY SYSTEMS
 IEA WORK ON FUTURE ELECTRICITY SYSTEMS Power grids, demand response and the low carbon transition Dr. Luis Munuera Smart Grids Technology Lead IEA Symposium on Demand Flexibility and RES Integration SMART
Energy consumption, GDP and energy intensity '85 '90 '95 '00 '05
 Index 198=1 The Danish example the way to an energy efficient and energy friendly economy February 29 Danish experience shows that through persistent and active energy policy focus on enhanced energy efficiency,
Overview of energy efficiency policies and trends at world level
 Overview of energy efficiency policies and trends at world level Dr Didier Bosseboeuf (ADEME, France) General secretary of the WEC energy efficiency policies Knowledge network Practical actions for accelerating
OXFORD ECONOMICS. Global Industry Services Overview
 OXFORD ECONOMICS Global Industry Services Overview 2016 ABOUT OXFORD ECONOMICS Oxford Economics is a world leader in global forecasting and quantitative analysis. Our worldwide client base comprises over
gas 2O18 Analysis and Forecasts to 2O23
 Market Report Series gas 2O18 Analysis and Forecasts to 2O23 executive summary INTERNATIONAL ENERGY AGENCY The IEA examines the full spectrum of energy issues including oil, gas and coal supply and demand,
Korea s Renewable Energy Policy - An Update -
 Korea s Renewable Energy Policy - An Update - Dr. Chang Hoon Lee 2016. 8. 5. Korea Environment Institute Contents 1 2 Renewable Energy Use Policy Framework - RPS 3 New Issues 4 Perspectives 2 Renewable
Energy and poverty. IEF Seminar December, 8 and 9
 Energy and poverty IEF Seminar December, 8 and 9 Jean-Pierre FAVENNEC President Association for the Development of Energy in Africa World energy consumption (toe/capita) North America Europ & F.S.U 4.1
IEA Buildings Webinar Series Webinar 4 Modeling and Data Peer Review
 IEA Buildings Webinar Series Webinar 4 Modeling and Data Peer Review Marc LaFrance, John Dulac and Siyue Guo, IEA Paris, 23 June 2014 2013 BUILDING PUBLICATIONS Dec 2013 Aug 2013 Jun 2013 Largest end-use
 Knowledge for Africa s Development: Innovation, Education, and Information and Communications Technologies Johannesburg, South Africa, May 8-10, 2006 DEVELOPING AND IMPLEMENTING KNOWLEDGE STRATEGIES EXPERIENCES
Energy Efficiency Indicators. Feedbacks from Odyssee and MURE
 Energy Efficiency Indicators Feedbacks from Odyssee and MURE Outline 1. Why energy efficiency indicators? 2. Introduction to ODYSSEE indicators in Europe 3. How ODYSSEE is used to adjust EE policies? 4.
Highlights. Figure 1. World marketed energy consumption, (quadrillion Btu)
") Highlights World marketed energy consumption increases by 49 percent from 27 to 235 in the Reference case. Total energy demand in the non-oecd countries increases by 84 percent, compared with an increase
Highlights World marketed energy consumption increases by 49 percent from 27 to 235 in the Reference case. Total energy demand in the non-oecd countries increases by 84 percent, compared with an increase
Scenario and outlook for energy efficiency. Vida Rozite, Energy Efficiency Unit
 Scenario and outlook for energy efficiency Vida Rozite, Energy Efficiency Unit vida.rozite@iea.org The world energy scene today Some long- held tenets of the energy sector are being rewri:en Countries
Renewables & Waste Questionnaire
 Renewables & Waste Questionnaire UNECE/EUROSTAT/EEA Workshop on Waste Statistics Geneva, 11 13 April Yasmina Abdelilah International Energy Agency OVERVIEW Renewable and waste energy in the world Classification
Comparing the main indicators for population, GDP, energy, CO2 and electricity of Brazil, Indonesia, Mexico, South Africa
 Renewables International - www.renewablesinternatonal.net Comparing the main indicators for population, GDP, energy, CO2 and electricity of Brazil, Indonesia, Mexico, South Africa Bernard CHABOT Sustainable
Environmental Best Practices, It Begins with Us: Business, Local Governments and International Community Should Work Together
 Environmental Best Practices, It Begins with Us: Business, Local Governments and International Community Should Work Together Jung Wan Lee, PhD Boston University, United States Objectives of the Paper
Background and objectives
 Workshop on greenhouse gas emission projections 12-13 December 2006, European Environment Agency, Copenhagen Background and objectives André Jol Head of Group climate change and energy European Environment
Benefit of collaboration: what was done, what is left to do? A European experience with the ODYSSEE project. Didier Bosseboeuf, ADEME
 Benefit of collaboration: what was done, what is left to do? A European experience with the ODYSSEE project Didier Bosseboeuf, ADEME Outline 1. The ODYSSEY of ODYSSEE 2. Key factors of success of ODYSSEE
SAMPLE. Reference Code: GDAE6214IDB. Publication Date: September GDAE6214IDB / Published SEP 2012
 Solar PV in Spain, Market Outlook to 2025 - Capacity, Generation, Levelized Cost of Energy (LCOE), Investment Trends, Regulations and Reference Code: GDAE6214IDB Publication Date: September 2012 GlobalData.
Coal 2O18 Analysis and Forecasts to 2O23
 Market Report Series Coal 2O18 Analysis and Forecasts to 2O23 Executive Summary INTERNATIONAL ENERGY AGENCY The IEA examines the full spectrum of energy issues including oil, gas and coal supply and demand,
Decision taken from September 2010 Four focus areas: megacities, informal sector, global recycling markets & international aid tools Members: Antonis
 ISWA s Task Force on Globalization & Waste Management Decision taken from September 2010 Four focus areas: megacities, informal sector, global recycling markets & international aid tools Members: Antonis
REPORT. State of the Nation Report landfilling practices and regulation in different countries. December, 2012
 REPORT State of the Nation Report landfilling practices and regulation in different countries December, 2012 ISWA the International Solid Waste Association is a global, independent and non-profit making
International practice and experience in energy efficiency indicators development Bruno Lapillonne, Vice President, Enerdata
 Stakeholders Meeting on Energy Data Analysis in Thailand 17 th September 2013, Bangkok Thailand International practice and experience in energy efficiency indicators development Bruno Lapillonne, Vice
ROLE OF OECD AND THE TEST GUIDELINES PROGRAMME IN THE REGULATORY ACCEPTANCE OF ALTERNATIVE METHODS
 ROLE OF OECD AND THE TEST GUIDELINES PROGRAMME IN THE REGULATORY ACCEPTANCE OF ALTERNATIVE METHODS Anne Gourmelon Principal Administrator OECD Test Guidelines Programme Environmental, Health and Safety
Non-technical Innovations Definition, Measurement & Policy Implications. The new service economy: growth and implications for service innovation
 Karlsruhe, October 2008 Non-technical Innovations Definition, Measurement & Policy Implications The new service economy: growth and implications for service innovation Professor of Economic Policy, University
Data Sources and Methods for the International Comparison of Air Pollutant Emissions Indicators. June 2015
 Data Sources and Methods for the International Comparison of Air Pollutant Emissions Indicators June 2015 Suggested citation for this document: Environment Canada (2015) Canadian Environmental Sustainability
Long Term Mitigation Scenarios For South Africa
 Long Term Mitigation Scenarios For South Africa Alison Hughes, Bruno Merven Energy Research Centre University of Cape Town 1 ERC South African Energy System Source: Energy Digest Department of Energy,
GHG Emissions from Energy Industry
 4.1 GHG Emissions from Energy Industry GHG Emissions from Energy Industry in the EU 19 2000 2005 2010 2011 2011/19 (%) Electricity and Heat Production 1 1,435 1,288 1,367 1,229 1,210 16 Petroleum Refining
National Laboratory Astana TIMES-Kazakhstan: from a national to a regional analysis and modelling
 National Laboratory Astana TIMES-Kazakhstan: from a national to a regional analysis and modelling Aiymgul Kerimray, Rocco De Miglio, Aidyn Bakdolotov, Igor Kolyagin, Bakytzhan Suleimenov, Yerbol Akhmetbekov
FCCC/SBI/2014/INF.20/Add.1
 United Nations FCCC/SBI/2014/INF.20/Add.1 Distr.: General 24 November 2014 English only Subsidiary Body for Implementation Forty-first session Lima, 1 8 December 2014 Item 3(b) of the provisional agenda
CROATIA. Risk Assessment Exercise
 CROATIA Risk Assessment Exercise JRC Institute for Energy Enlargement and Integration Workshop, 5-7 October 211 Hotel Valamar Lacroma, Dubrovnik, Croatia Robert Bošnjak, Energy Institute Hrvoje Požar BASIC
Compact city policies: a comparative assessment
 Compact city policies: a comparative assessment TADASHI MATSUMOTO 松本忠 Organisation for Economic Corporation and Development (OECD) Presentation at the World Bank seminar, March 13 th, 2012, Washington
China s Energy Challenges and Energy Efficiency in China s Energy Future Li Pengcheng China National Institute of Standardization
 41 st APEC EGEE&C Meeting & Workshop April 11-12, 2013 Beijing, China China s Energy Challenges and Energy Efficiency in China s Energy Future Li Pengcheng China National Institute of Standardization Content
Center on Global Energy Policy Columbia University New York NY, October 15, Philippe Benoit Head, Energy Efficiency and Environment Division
 Center on Global Energy Policy Columbia University New York NY, October 15, 2015 Philippe Benoit Head, Energy Efficiency and Environment Division Prologue Changing oil & gas prices 25 140 20 120 100 15
Pollution is nothing but the resources we are not harvesting. We allow them to disperse because we ve been ignorant of their value.
 III. Waste Management Economic growth, urbanisation and industrialisation result in increasing volumes and varieties of both solid and hazardous wastes. Globalisation can aggravate waste problems through
Assessing country procurement systems and supporting good practice: The contribution of the 2015 OECD Recommendation on Public Procurement
 Assessing country procurement systems and supporting good practice: The contribution of the 2015 OECD Recommendation on Public Procurement WTO Symposium on Government Procurement Agreement 17 September